State of the Index: 178 Economies
The annual read, now across 178 economies on a rebuilt evidence base, and a test of our own headline that the headline did not survive
This edition follows an earlier one. Read how the picture looked before: State of the Index 2026 (June 2026).
This is the second State of the Index from Innovative EcoSystems. Since the first edition in June, the Index has grown from 117 economies to 178, and every score in it has been rebuilt on a deeper, fully re-verified evidence base. The numbers here replace the June numbers and cannot be compared with them. The June edition stays published as the record of what we knew then. This edition also reruns the two structural tests the June report rested on. One of them failed. In June we reported that an economy's weakest zone predicts its prosperity better than its strongest. On the rebuilt Index that edge disappears. What predicts prosperity is the overall level of an economy's foundations, and each point of that level is worth about 0.7 points of prosperity.
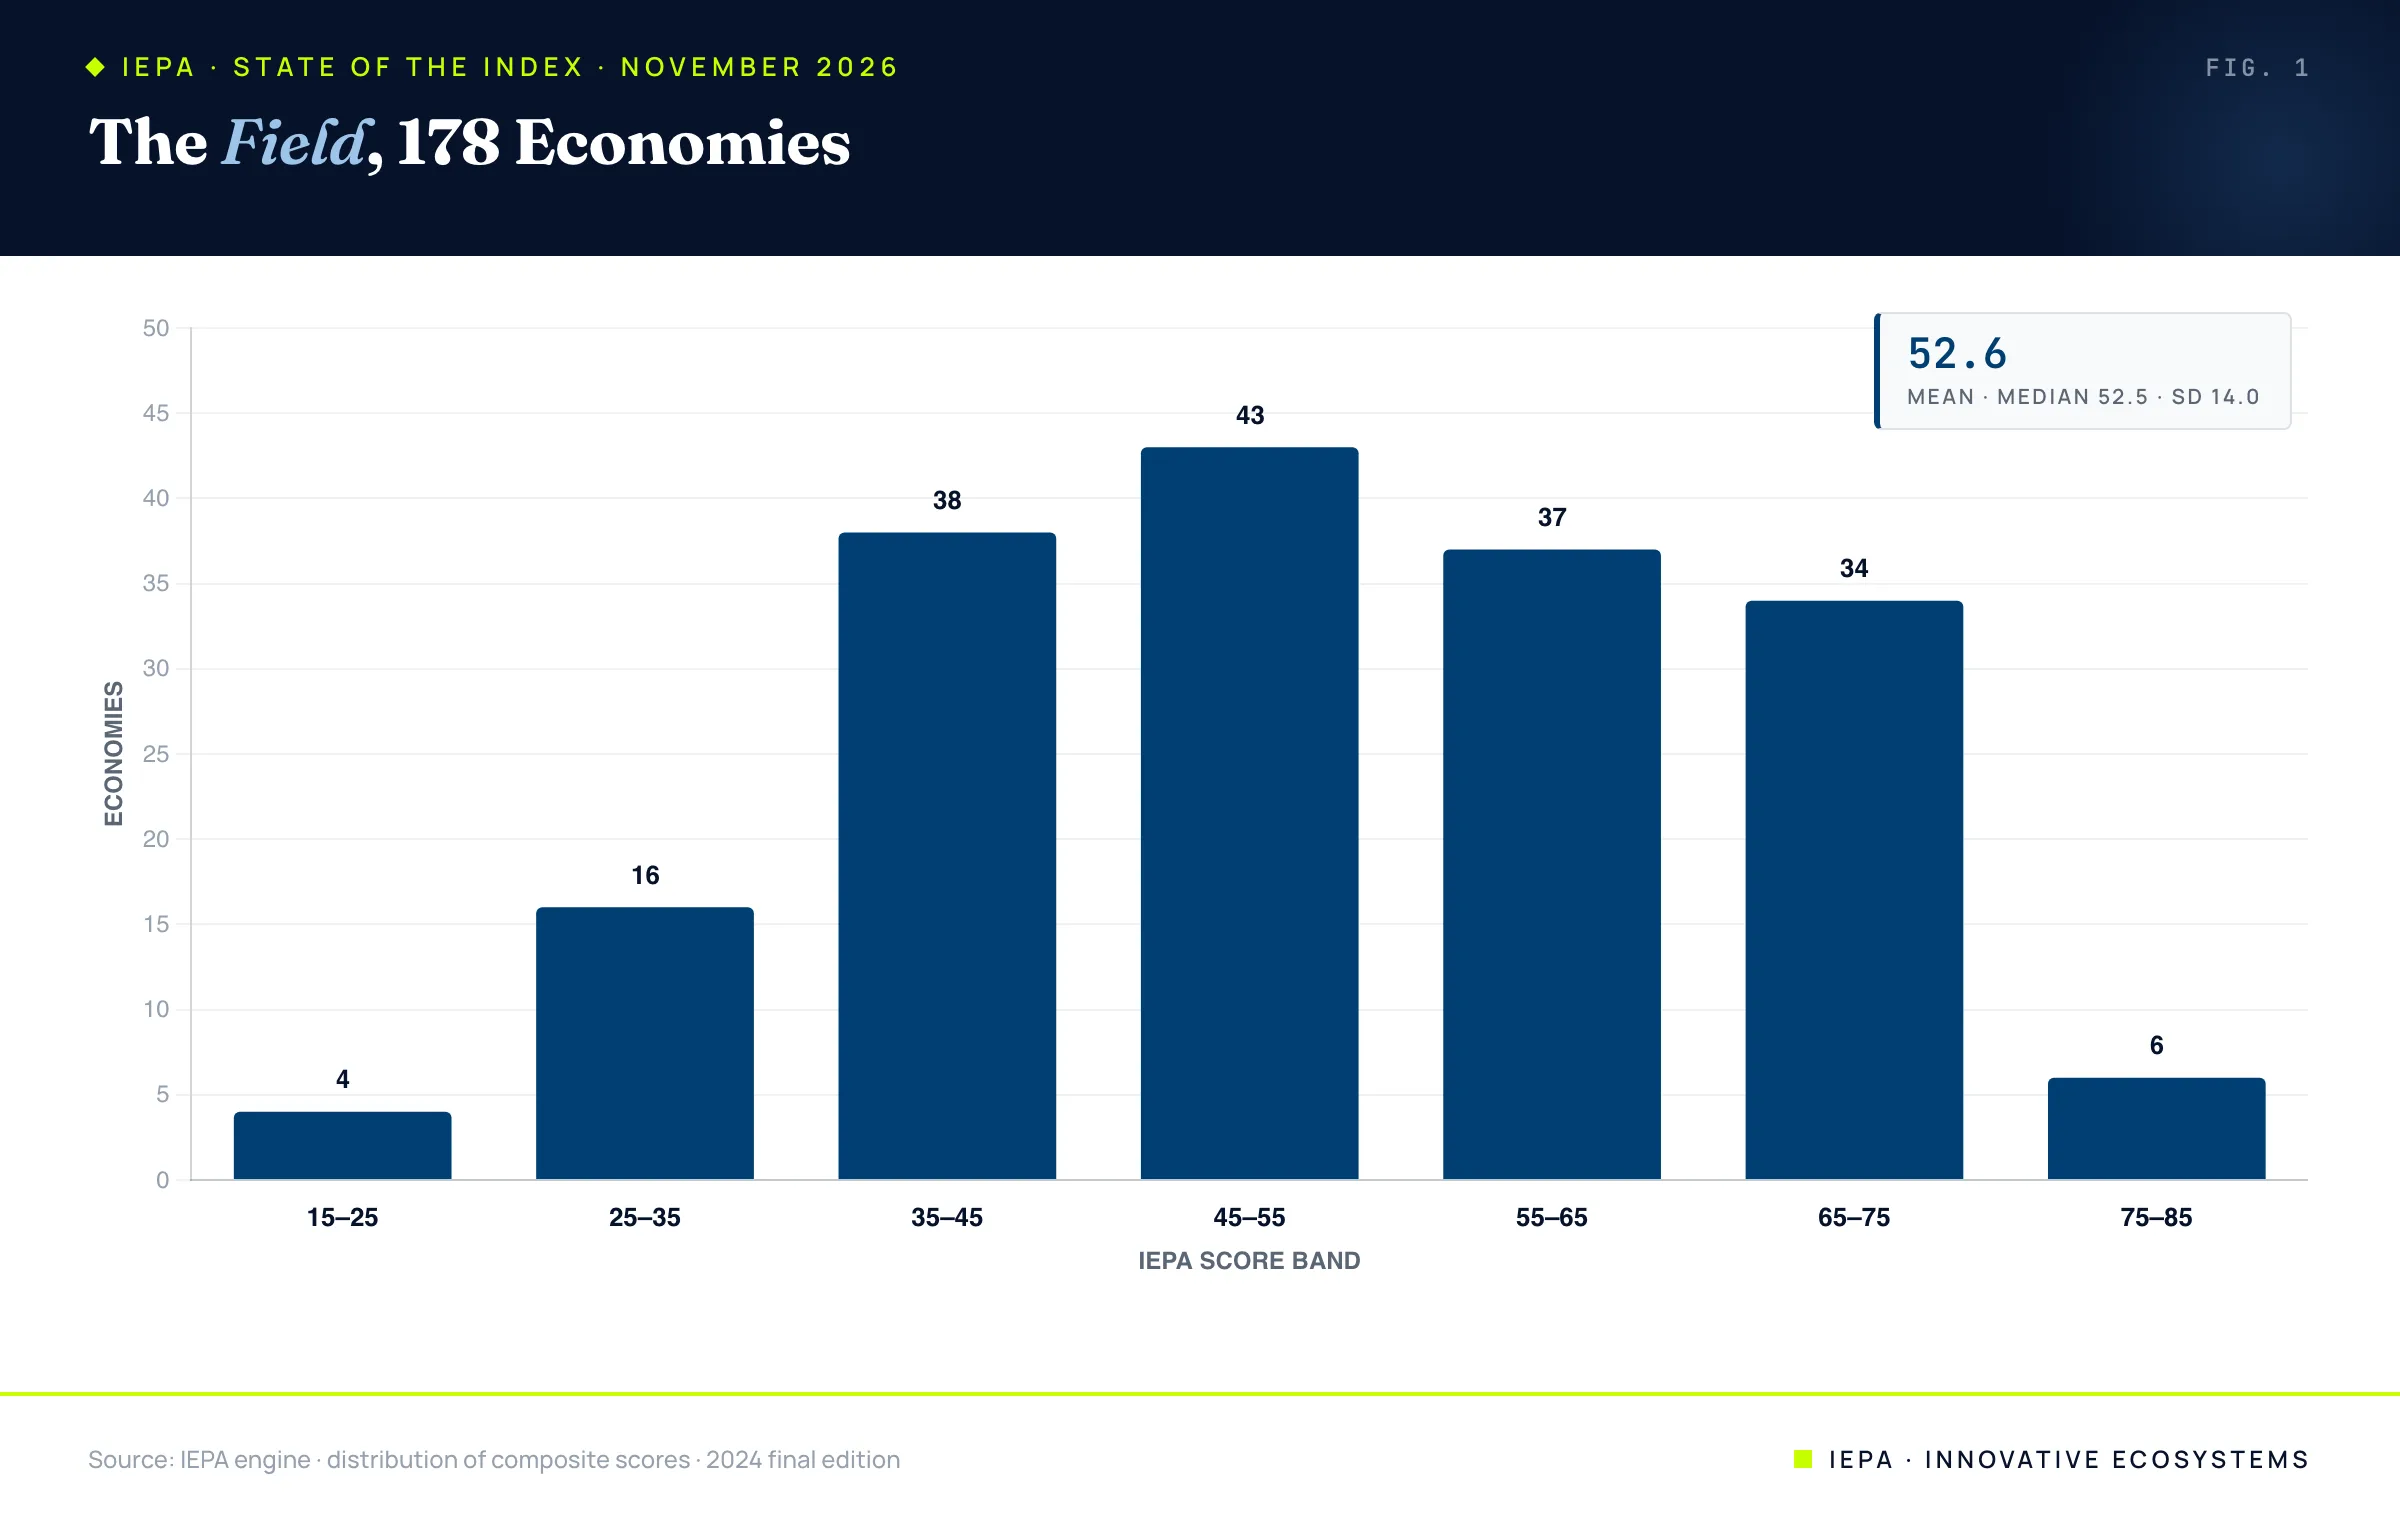
- The field. 178 economies, mean 52.6, median 52.5, standard deviation 14.0. Six clear 75. Twenty sit below 35.
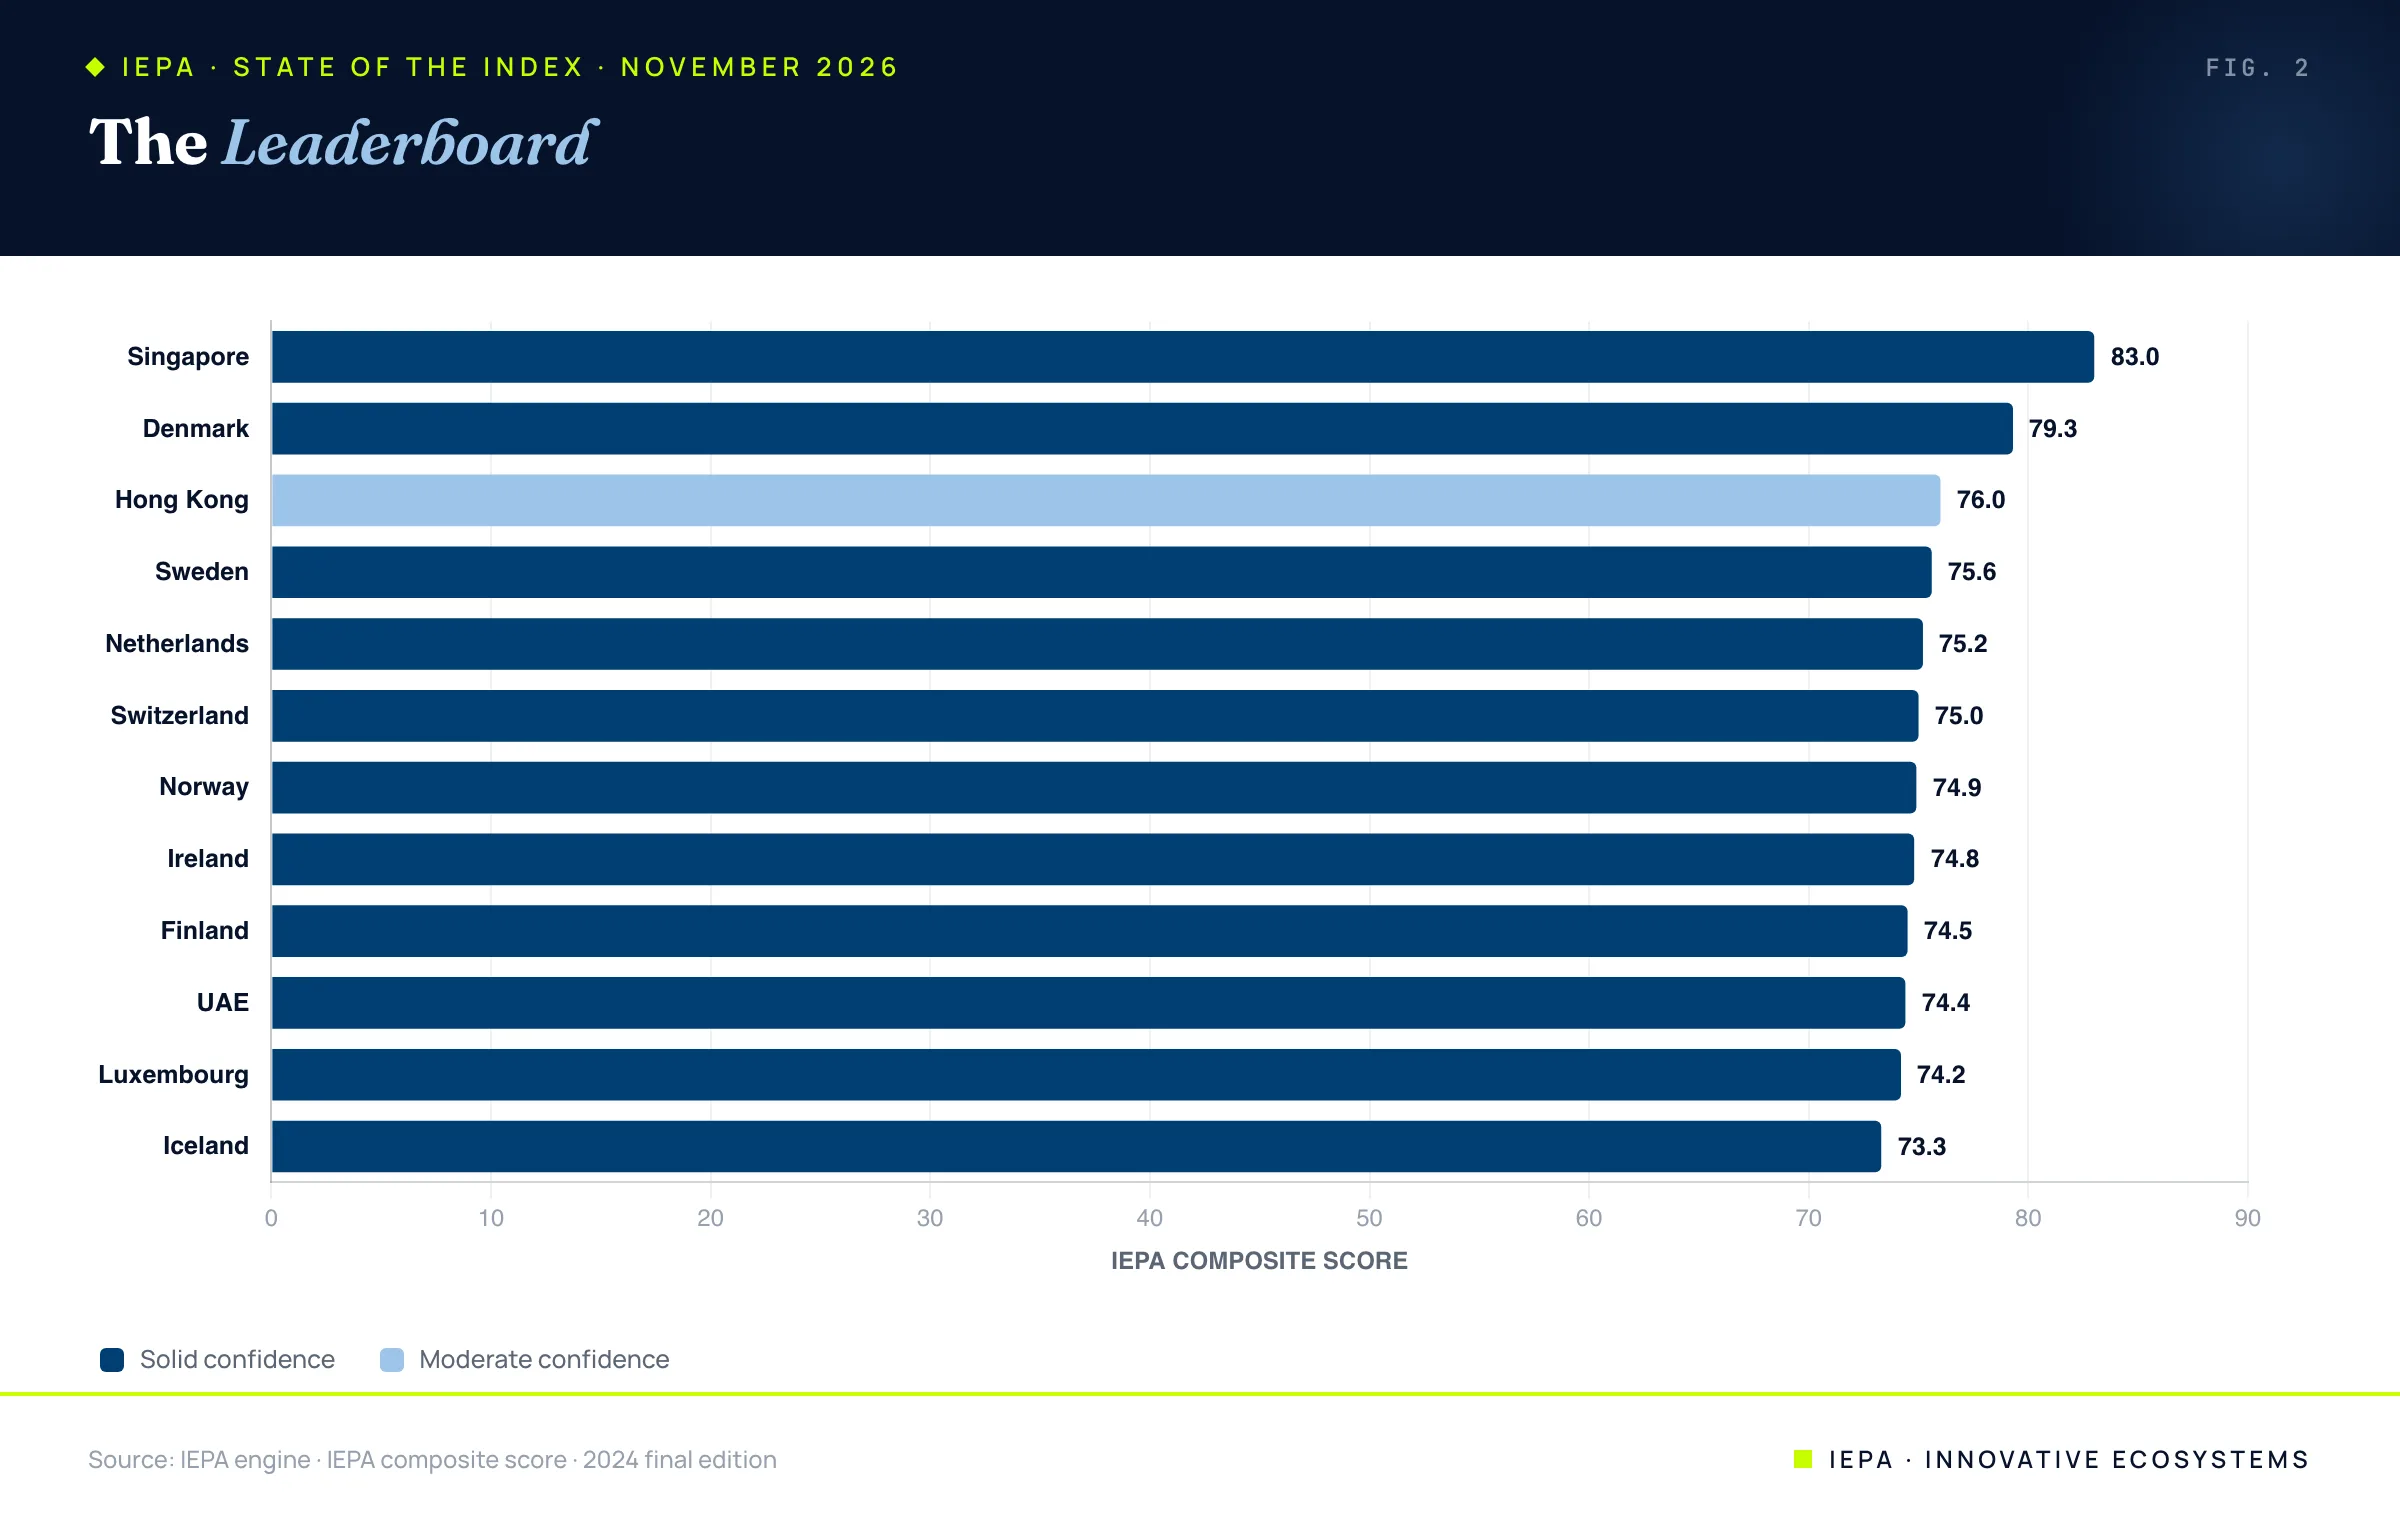
- Singapore leads at 83.0, ahead of Denmark (79.3), Hong Kong (76.0), Sweden (75.6) and the Netherlands (75.2). Seventeen of the top twenty economies of 2010 are still in the top twenty.
- The weakest-link claim is retired. Once the average of the five input zones is accounted for, the weakest zone adds nothing (coefficient -0.002, t = -0.02).
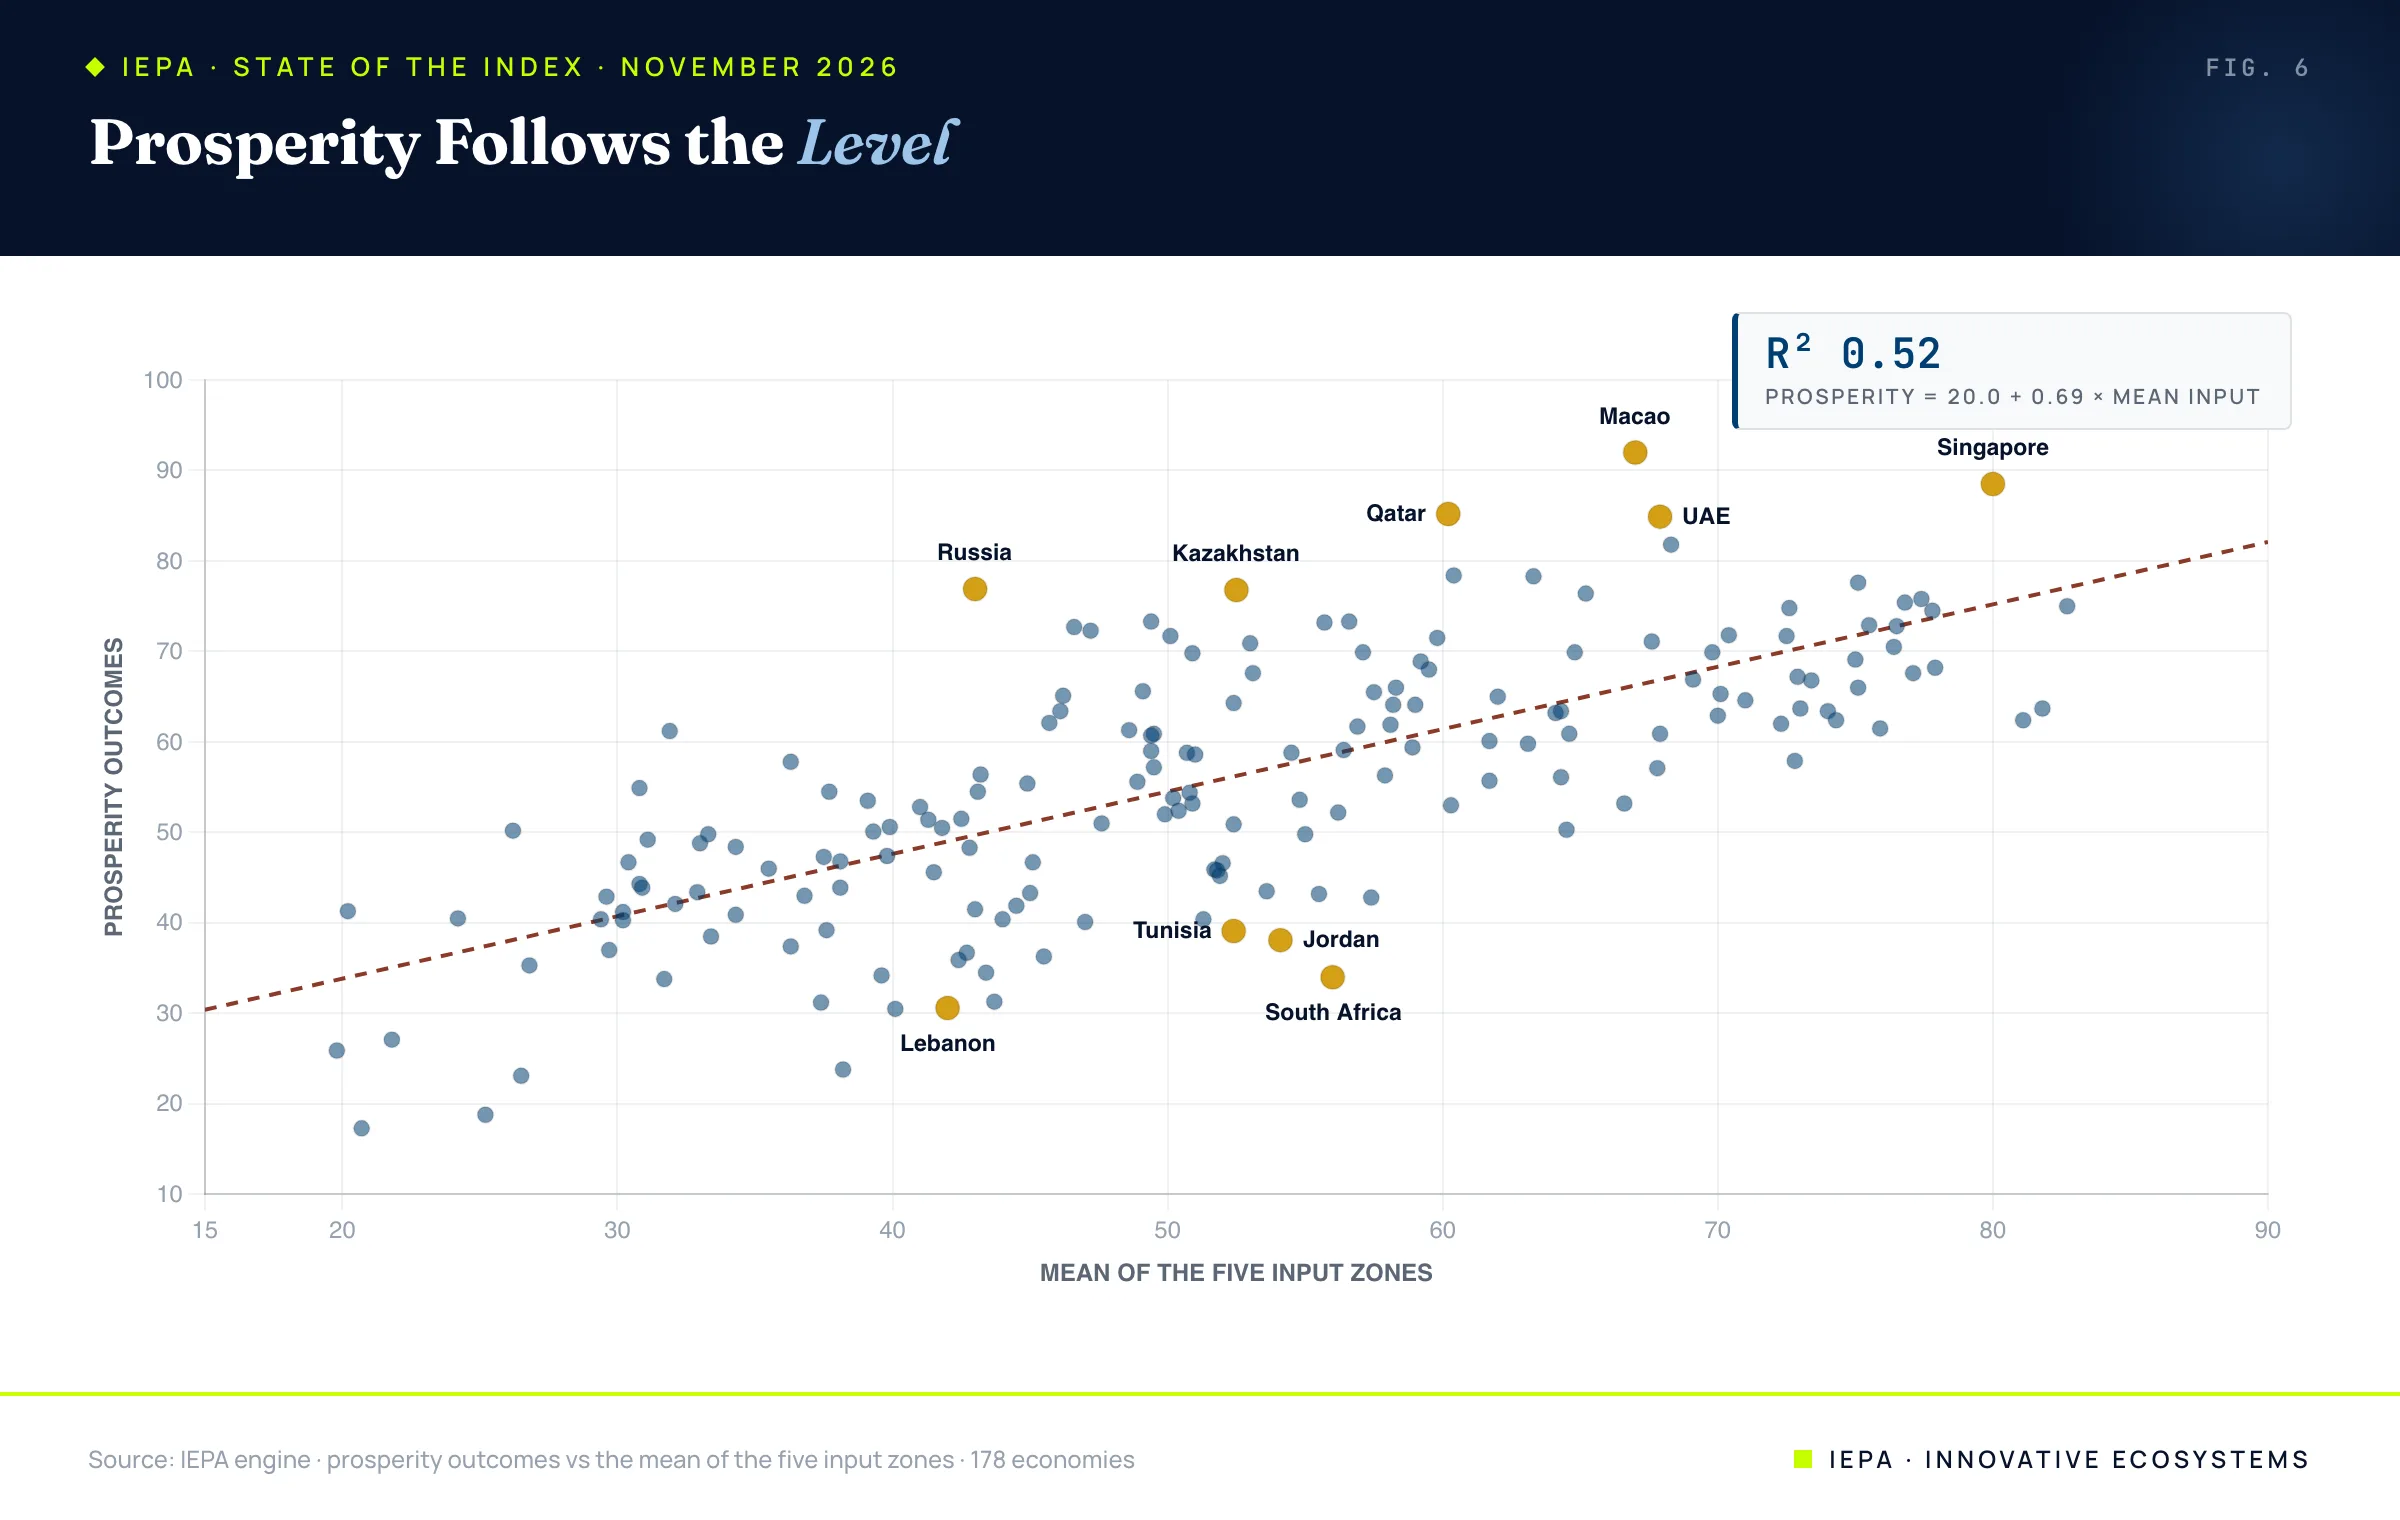
- Prosperity follows the level. Prosperity = 20.0 + 0.69 × mean input, R² 0.52. The economies furthest above that line are mostly hydrocarbon exporters and specialized rent economies.
- No convergence. Where an economy stood in 2010 explains almost none of its change since (slope -0.010, R² 0.001). The lowest quartile gained least: +1.5 points, against +2.9 for the third quartile.
- The bottom is falling further behind. The gap between the top and bottom deciles grew from 44.0 to 45.5 points, and 20 of the 45 lowest-ranked economies of 2010 score lower today.
An index earns trust by showing its work, and that includes the work that changes its mind. Five months ago we published the first State of the Index on 117 economies. Since then we have rebuilt the evidence underneath every score and extended the Index to 178 economies. This edition reports what the larger, better-evidenced Index says, and where it disagrees with what we said in June.
01What Changed in This Edition
Three things changed, and all three move the numbers. Coverage. The Index now scores 178 economies, up from 117 in June. The 61 additions include Iceland, Albania, Belarus, Bosnia and Herzegovina, Moldova, El Salvador, Laos, Fiji and Guyana, along with many African, Caribbean and Pacific economies that were missing. Depth. Every economy is now scored on the same evidence set: 59 indicators on average, with none of the old split between a deeply measured core and a thinly measured remainder. Verification. Every input was reloaded for its full coverage and checked against its published record before it was allowed to count.
The practical consequence is that scores in this edition are a new series. Many of the Index's inputs rank an economy against the whole field, so a larger field shifts every score in it, and the deeper evidence set shifts them again. A score here should not be set beside a score from the June edition and read as change over time. Change over time is measured inside this edition, where all 178 economies are scored on the same basis for every year from 2010.
Confidence travels with every score. 124 of the 178 economies sit in the Solid band (0.85 and above) and the other 54 in the Moderate band. The default leaderboards on the site show the Solid band. This report uses all 178 and marks the Moderate-band economies where they appear.
02The Field at a Glance
The 2024 final edition has a mean of 52.6 and a median of 52.5, with a standard deviation of 14.0. Scores run from 19.1 (Sudan) to 83.0 (Singapore). The distribution is close to symmetric and thick in the middle: 118 of the 178 economies score between 35 and 65.
| Score band | Economies | Share |
|---|---|---|
| 75 to 85 | 6 | 3% |
| 65 to 75 | 34 | 19% |
| 55 to 65 | 37 | 21% |
| 45 to 55 | 43 | 24% |
| 35 to 45 | 38 | 21% |
| 25 to 35 | 16 | 9% |
| 15 to 25 | 4 | 2% |
03The Leaderboard
Singapore leads the Index at 83.0, nearly four points clear of Denmark. Behind them the field is tight: nine economies sit within two points of each other between 74 and 76. Northern Europe holds six of the top twelve places.
| Rank | Economy | IEPA | Confidence | Prosperity |
|---|---|---|---|---|
| 1 | Singapore | 83.0 | Solid | 88.5 |
| 2 | Denmark | 79.3 | Solid | 75.0 |
| 3 | Hong Kong | 76.0 | Moderate | 72.8 |
| 4 | Sweden | 75.6 | Solid | 63.7 |
| 5 | Netherlands | 75.2 | Solid | 75.4 |
| 6 | Switzerland | 75.0 | Solid | 75.8 |
| 7 | Norway | 74.9 | Solid | 74.5 |
| 8 | Ireland | 74.8 | Solid | 77.6 |
| 9 | Finland | 74.5 | Solid | 62.4 |
| 10 | UAE | 74.4 | Solid | 84.9 |
| 11 | Luxembourg | 74.2 | Solid | 68.2 |
| 12 | Iceland | 73.3 | Solid | 72.9 |
| 13 | Macao | 73.2 | Moderate | 92.0 |
| 14 | United Kingdom | 73.0 | Solid | 67.6 |
| 15 | Australia | 72.8 | Solid | 70.5 |
The United States scores 69.2 and ranks 28th. It is third on innovation capacity and fourth on entrepreneurship capacity, and 131st on the FDI accelerator, which measures investment against the size of the economy. Germany scores 70.7 and ranks 21st: sixth on innovation capacity, 63rd on the FDI accelerator.
The top of the table is slow to change. Seventeen of the twenty highest-ranked economies of 2010 are still in the top twenty. The UAE, the Czech Republic and Canada have entered it; Qatar, Germany and Estonia have left. Across all 178 economies the correlation between 2010 rank and 2024 rank is 0.93.
04Zone Leaders
No economy leads more than one zone, and only Denmark and Norway appear among the top three in two input zones each. Leadership on the composite comes from being strong everywhere, which is how Singapore leads the Index while leading none of the five input zones.
| Zone | First | Second | Third |
|---|---|---|---|
| Innovation capacity | South Korea 92.8 | Sweden 91.8 | United States 90.3 |
| Entrepreneurship capacity | Hong Kong 88.7 | United Kingdom 88.2 | Australia 88.1 |
| Resilience | Finland 84.9 | Norway 83.4 | Denmark 83.1 |
| Alignment | Denmark 88.9 | Norway 86.7 | New Zealand 86.6 |
| FDI accelerator | Guyana 84.7 | Maldives 84.5 | UAE 81.1 |
| Prosperity outcomes | Macao 92.0 | Singapore 88.5 | Qatar 85.2 |
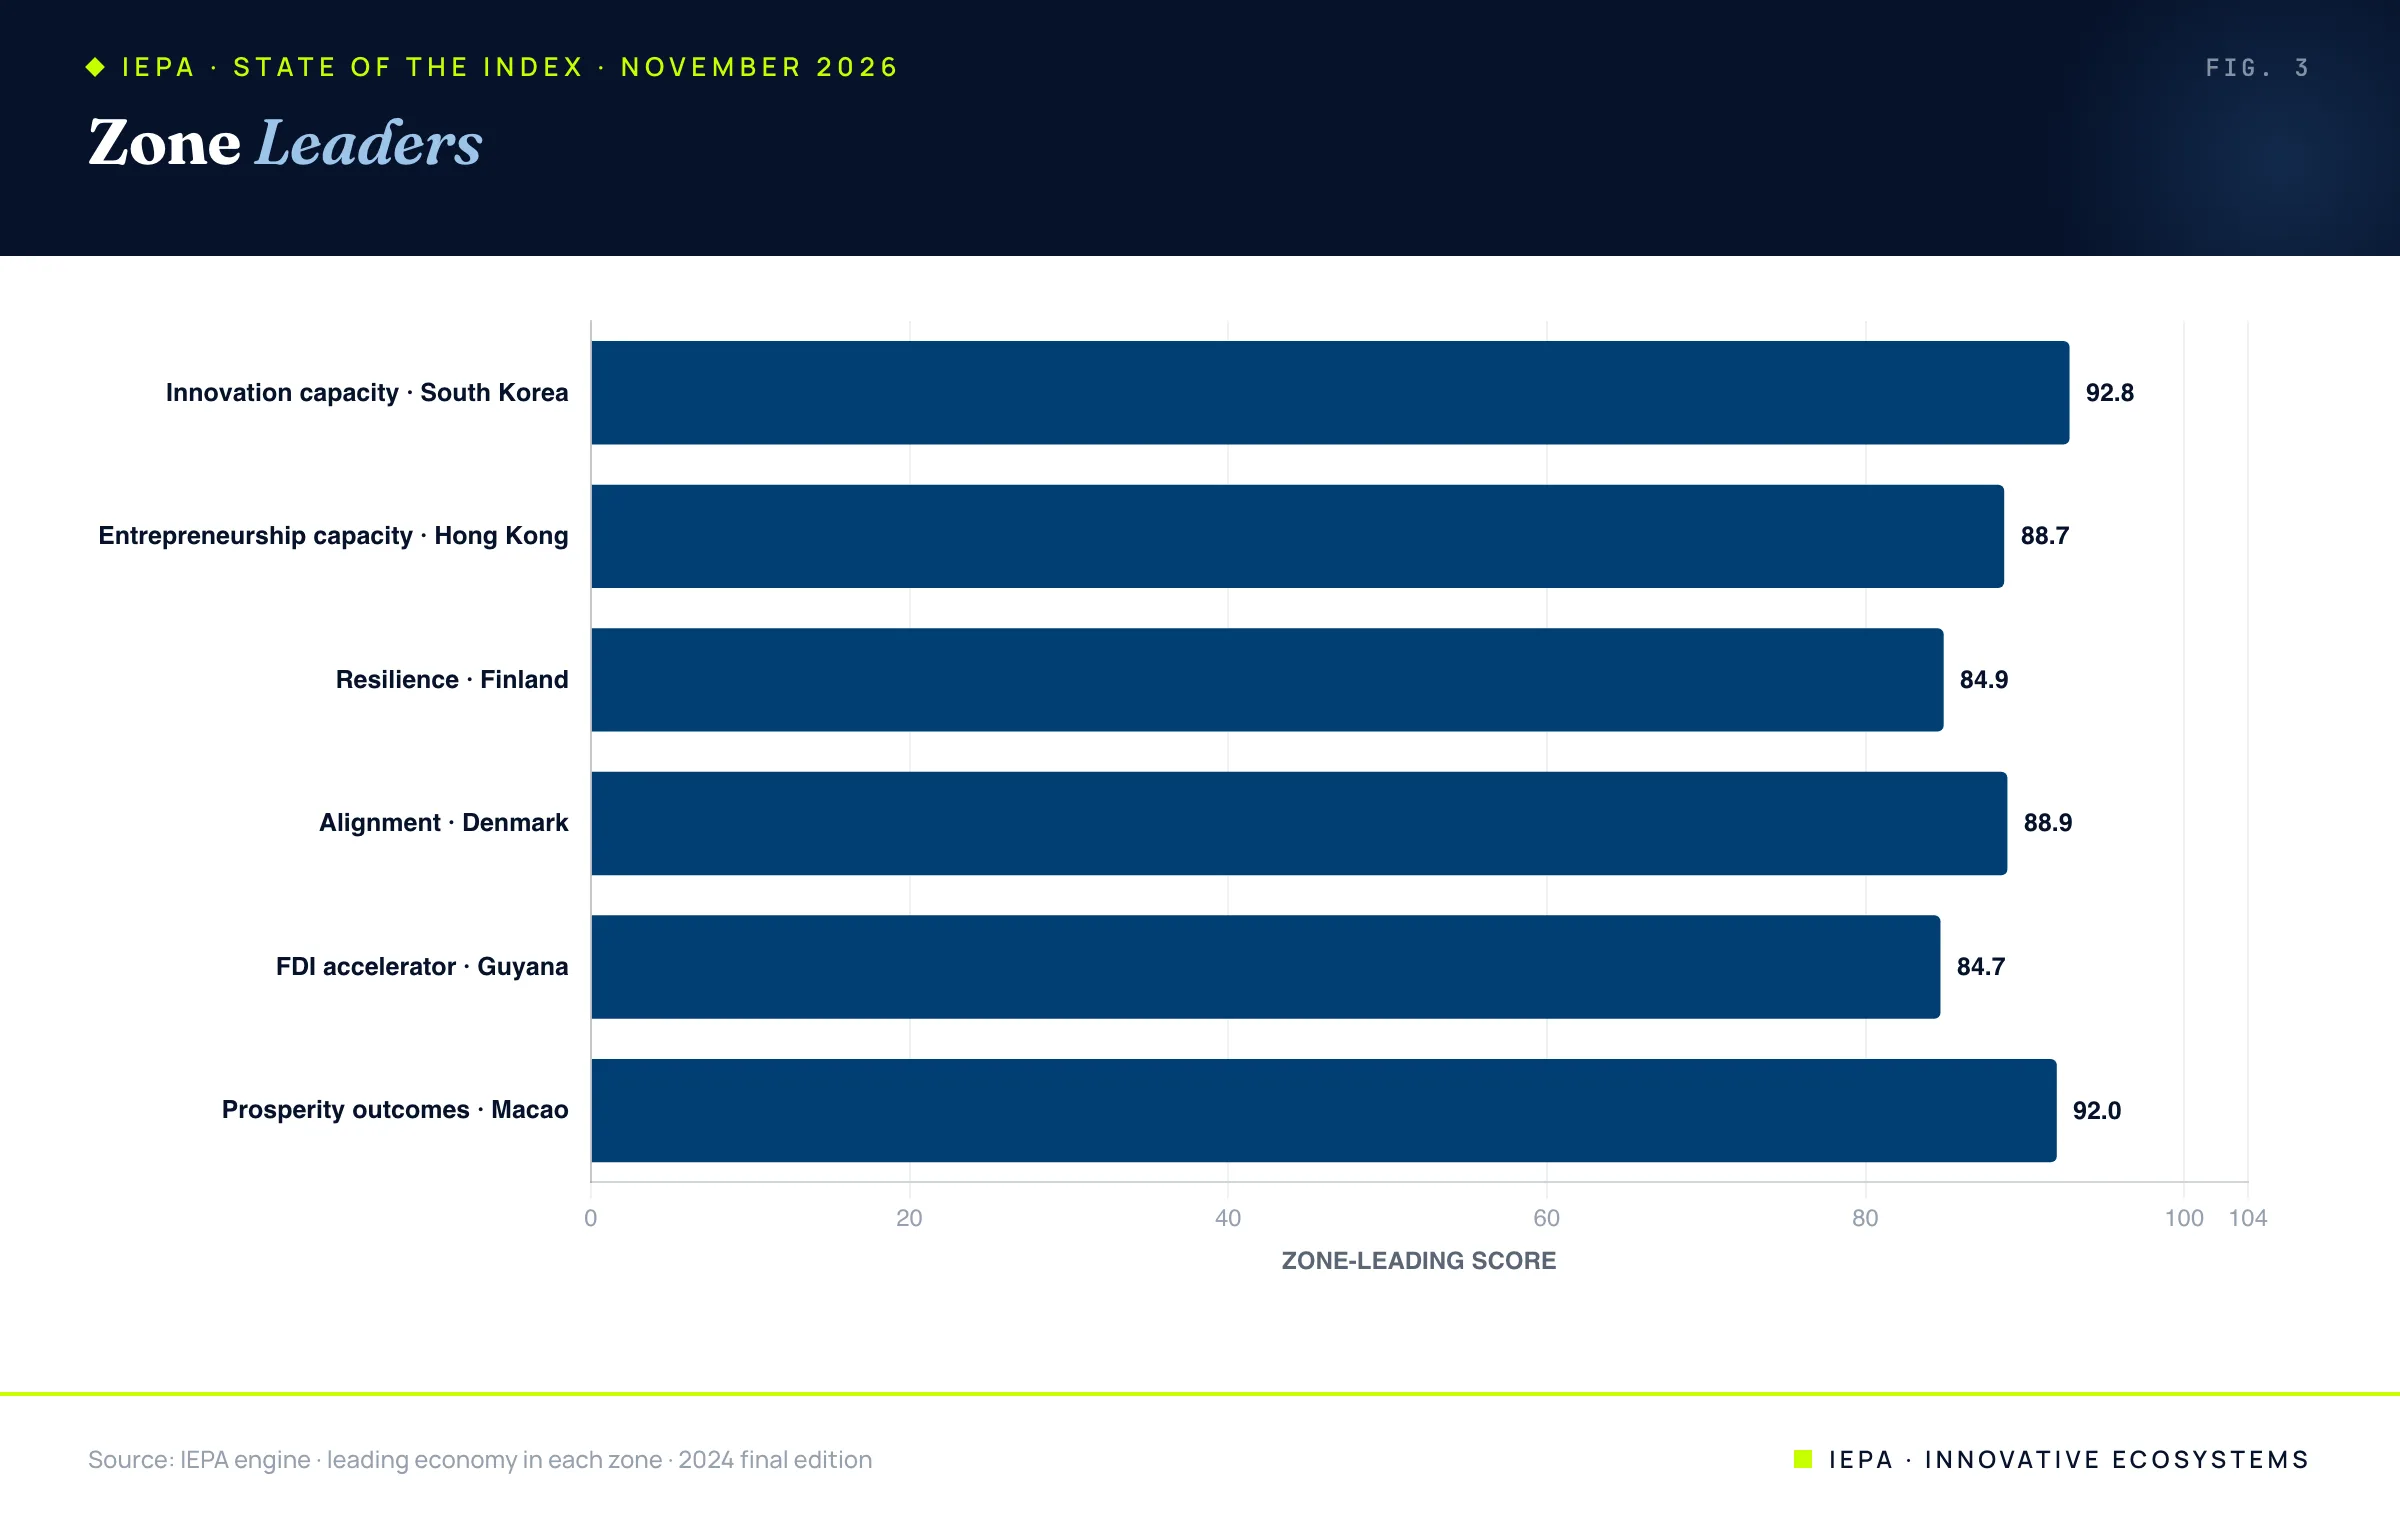
The FDI accelerator reads differently in this edition. It now gives weight to new projects announced on the ground, measured against the size of the economy, alongside recorded investment flows. That is why its leaders are small economies absorbing investment that is very large relative to their size, Guyana and the Maldives ahead of the UAE, and why the financial hubs that topped this zone in June have moved down it. Five economies where inward and outward investment stock each exceed 150% of GDP (Luxembourg, Hong Kong, Singapore, the Netherlands and Ireland) now carry a pass-through note on their market pages. The note informs the reading and leaves the score alone.
05The Movers, 2010 to 2024
Sixty-five percent of economies score higher in 2024 than in 2010, and the average change is +2.1 points. The large moves in either direction are driven by the same two zones: the FDI accelerator and prosperity outcomes. Foundations move slowly. Capital and outcomes swing.
| Economy | 2010 | 2024 | Change | Largest zone moves |
|---|---|---|---|---|
| Guyana | 45.0 | 60.4 | +15.4 | Prosperity +26.4, FDI +23.6 |
| Senegal | 37.4 | 50.8 | +13.4 | FDI +31.4, Innovation +17.7 |
| Djibouti | 32.3 | 45.0 | +12.8 | Prosperity +24.6, FDI +21.1 |
| Croatia | 55.6 | 68.3 | +12.7 | Prosperity +23.3, FDI +17.7 |
| Serbia | 51.5 | 63.2 | +11.8 | FDI +20.6, Prosperity +17.7 |
| Georgia | 52.4 | 63.8 | +11.5 | Innovation +22.6, Prosperity +16.6 |
| Latvia | 58.0 | 68.6 | +10.7 | Prosperity +17.7, FDI +16.2 |
| North Macedonia | 50.6 | 61.0 | +10.3 | FDI +15.3, Innovation +13.8 |
| Economy | 2010 | 2024 | Change | Largest zone moves |
|---|---|---|---|---|
| Lebanon | 58.3 | 39.4 | -18.9 | Prosperity -28.5, Entrepreneurship -23.1 |
| Equatorial Guinea | 41.8 | 28.9 | -12.9 | FDI -70.3, Innovation +14.5 |
| Sudan | 27.3 | 19.1 | -8.2 | FDI -19.6, Prosperity -12.4 |
| Niger | 40.2 | 32.1 | -8.1 | FDI -37.1, Innovation +5.1 |
| State of Palestine | 41.5 | 33.5 | -8.0 | Prosperity -17.5, FDI -15.3 |
| Chad | 33.3 | 25.3 | -8.0 | FDI -28.5, Innovation +13.5 |
| Bolivia | 49.0 | 42.0 | -7.0 | FDI -19.8, Alignment -7.6 |
| Mozambique | 46.0 | 39.0 | -7.0 | Prosperity -19.6, Entrepreneurship -11.6 |
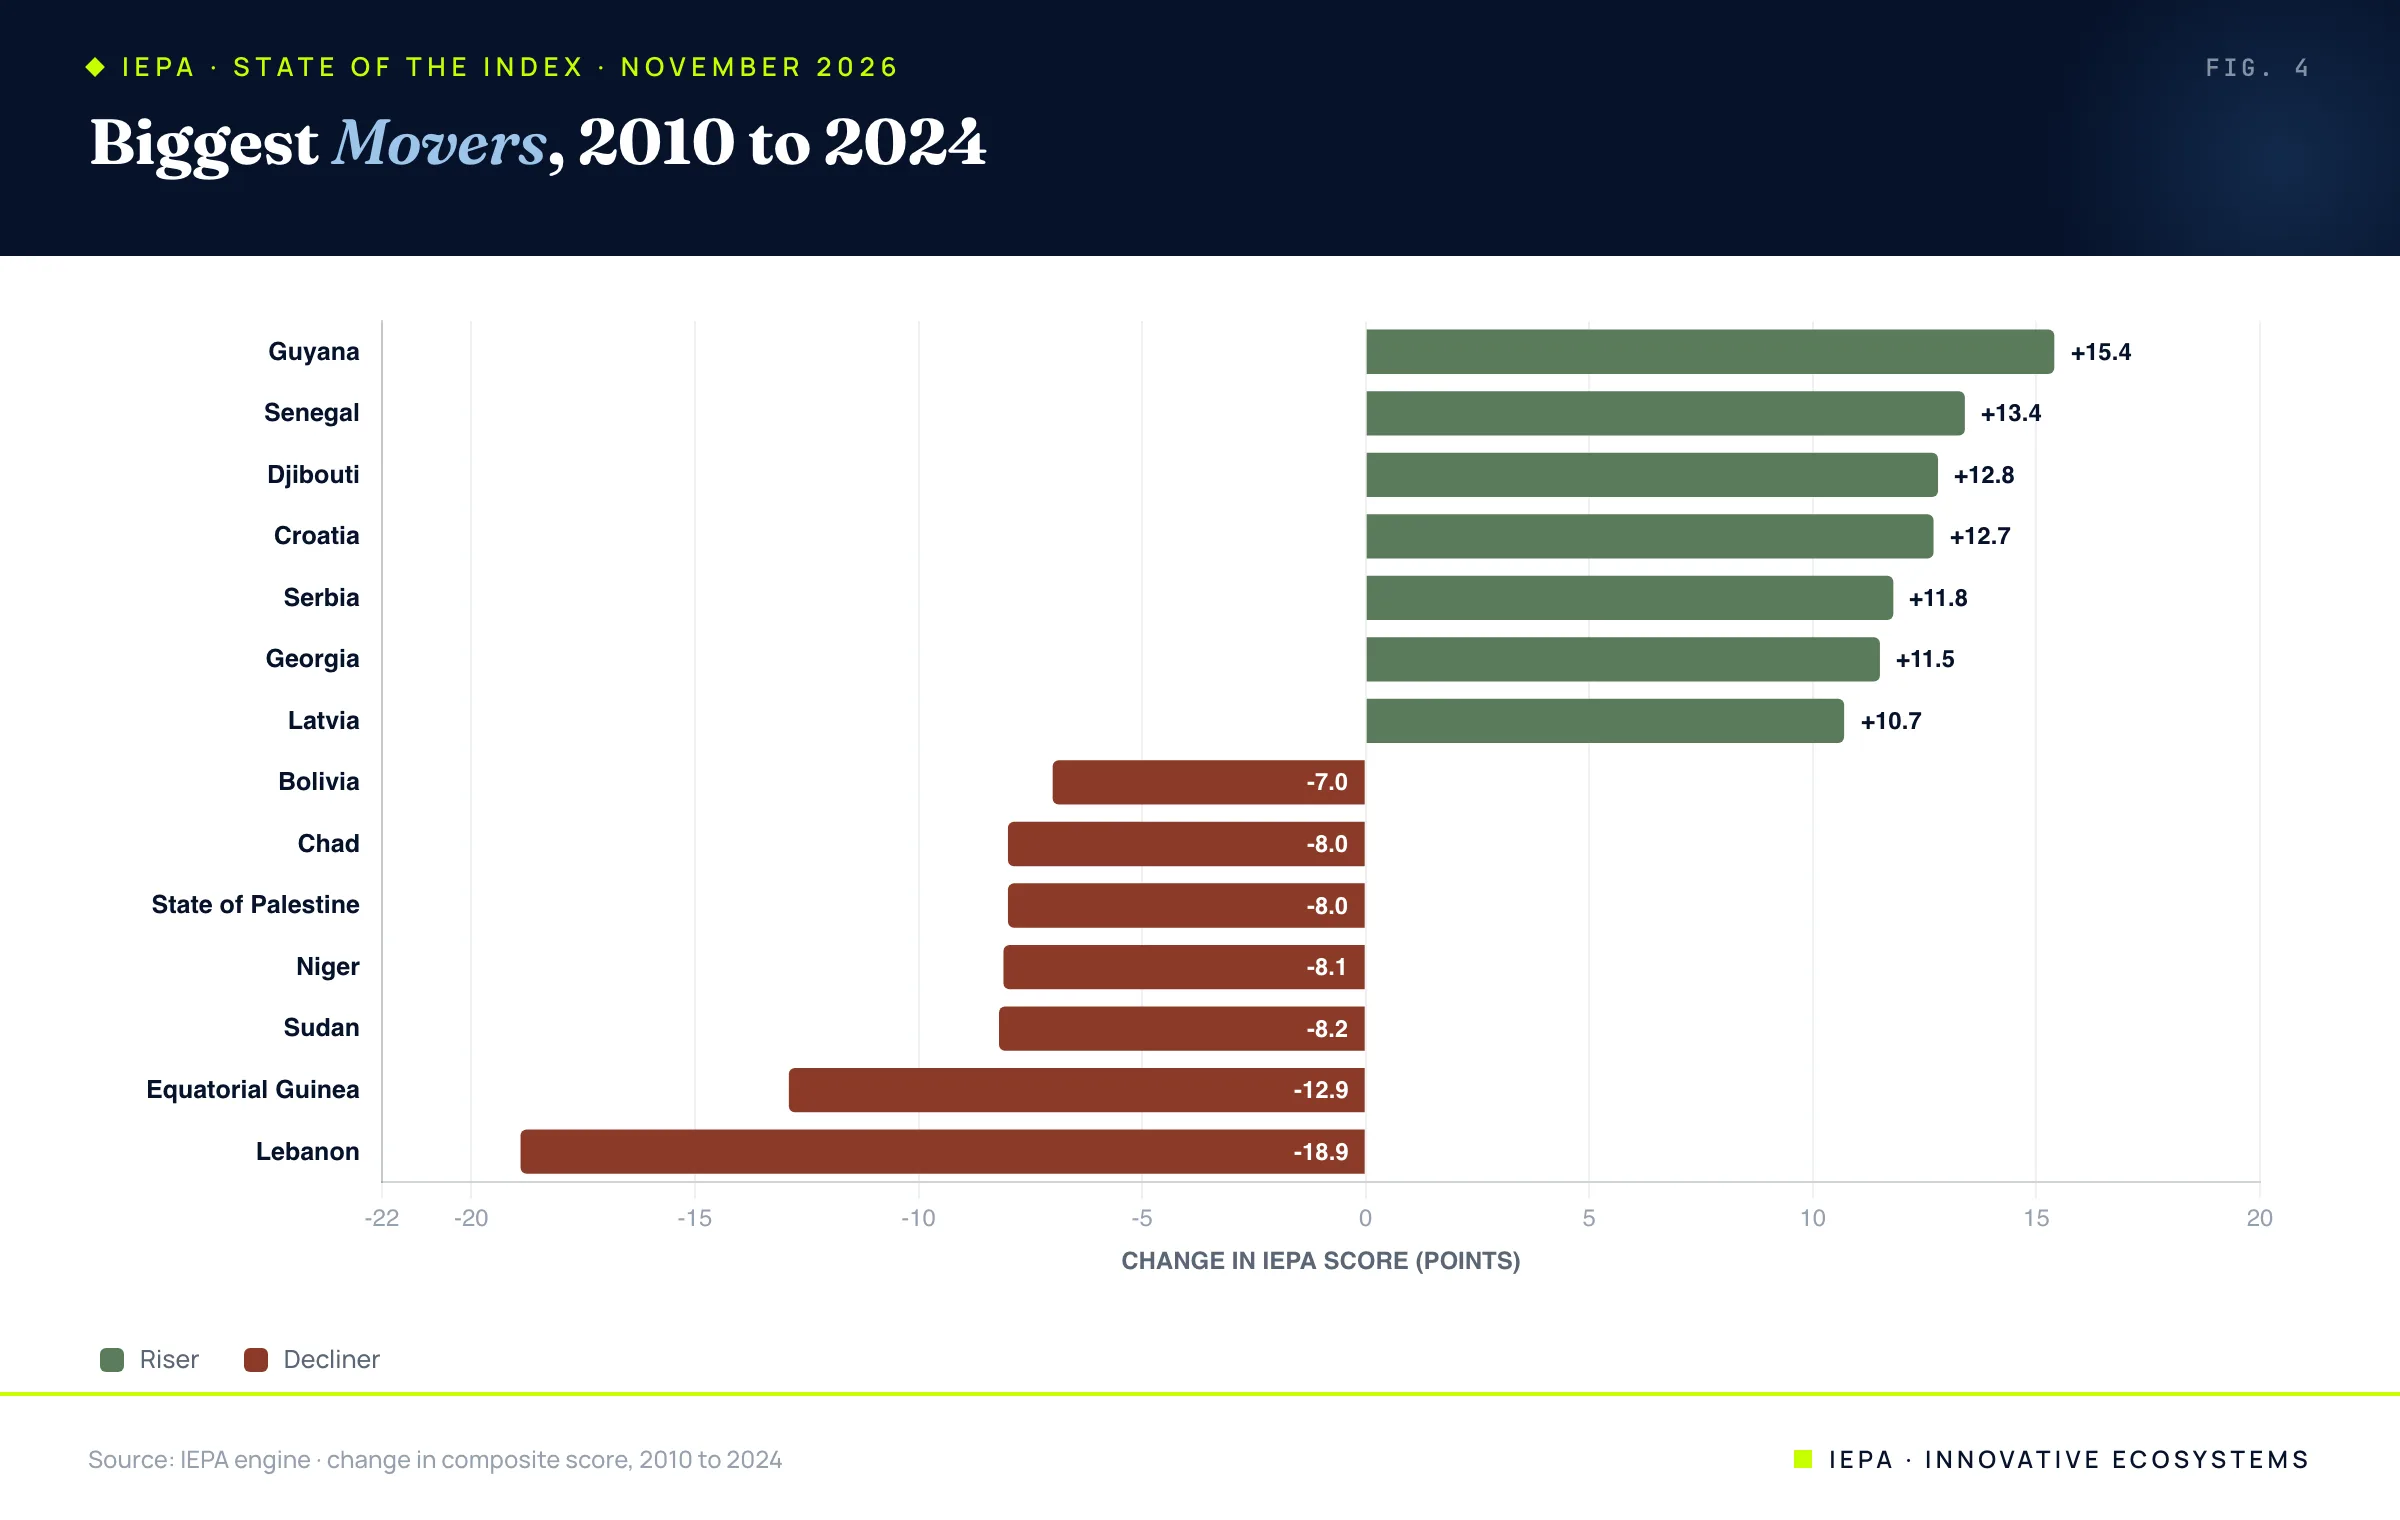
Two patterns sit inside these tables. The risers split into investment-led jumps in smaller economies (Guyana, Senegal, Djibouti) and a Balkan and Baltic group (Croatia, Serbia, Latvia, North Macedonia) where investment and outcomes rose together. Georgia is the exception worth studying: its largest gain is innovation capacity, a foundation zone, at +22.6. The decliners are mostly economies where investment collapsed, several of them while innovation capacity was still rising. Rising capability did not protect them.
06The Regional Picture
| Region | Economies | Mean | Leader | Change since 2010 | Strongest input zone | Weakest input zone |
|---|---|---|---|---|---|---|
| Europe | 39 | 67.3 | Denmark 79.3 | +3.9 | Innovation 73.2 | FDI 60.8 |
| Asia | 47 | 54.3 | Singapore 83.0 | +2.5 | Innovation 53.7 | FDI 49.9 |
| Oceania | 8 | 54.0 | Australia 72.8 | +3.0 | Alignment 62.9 | Innovation 50.1 |
| Americas | 32 | 51.8 | Canada 71.8 | +1.1 | Alignment 54.6 | FDI 43.6 |
| Africa | 52 | 40.4 | Seychelles 62.7 | +0.9 | FDI 45.3 | Innovation 31.4 |
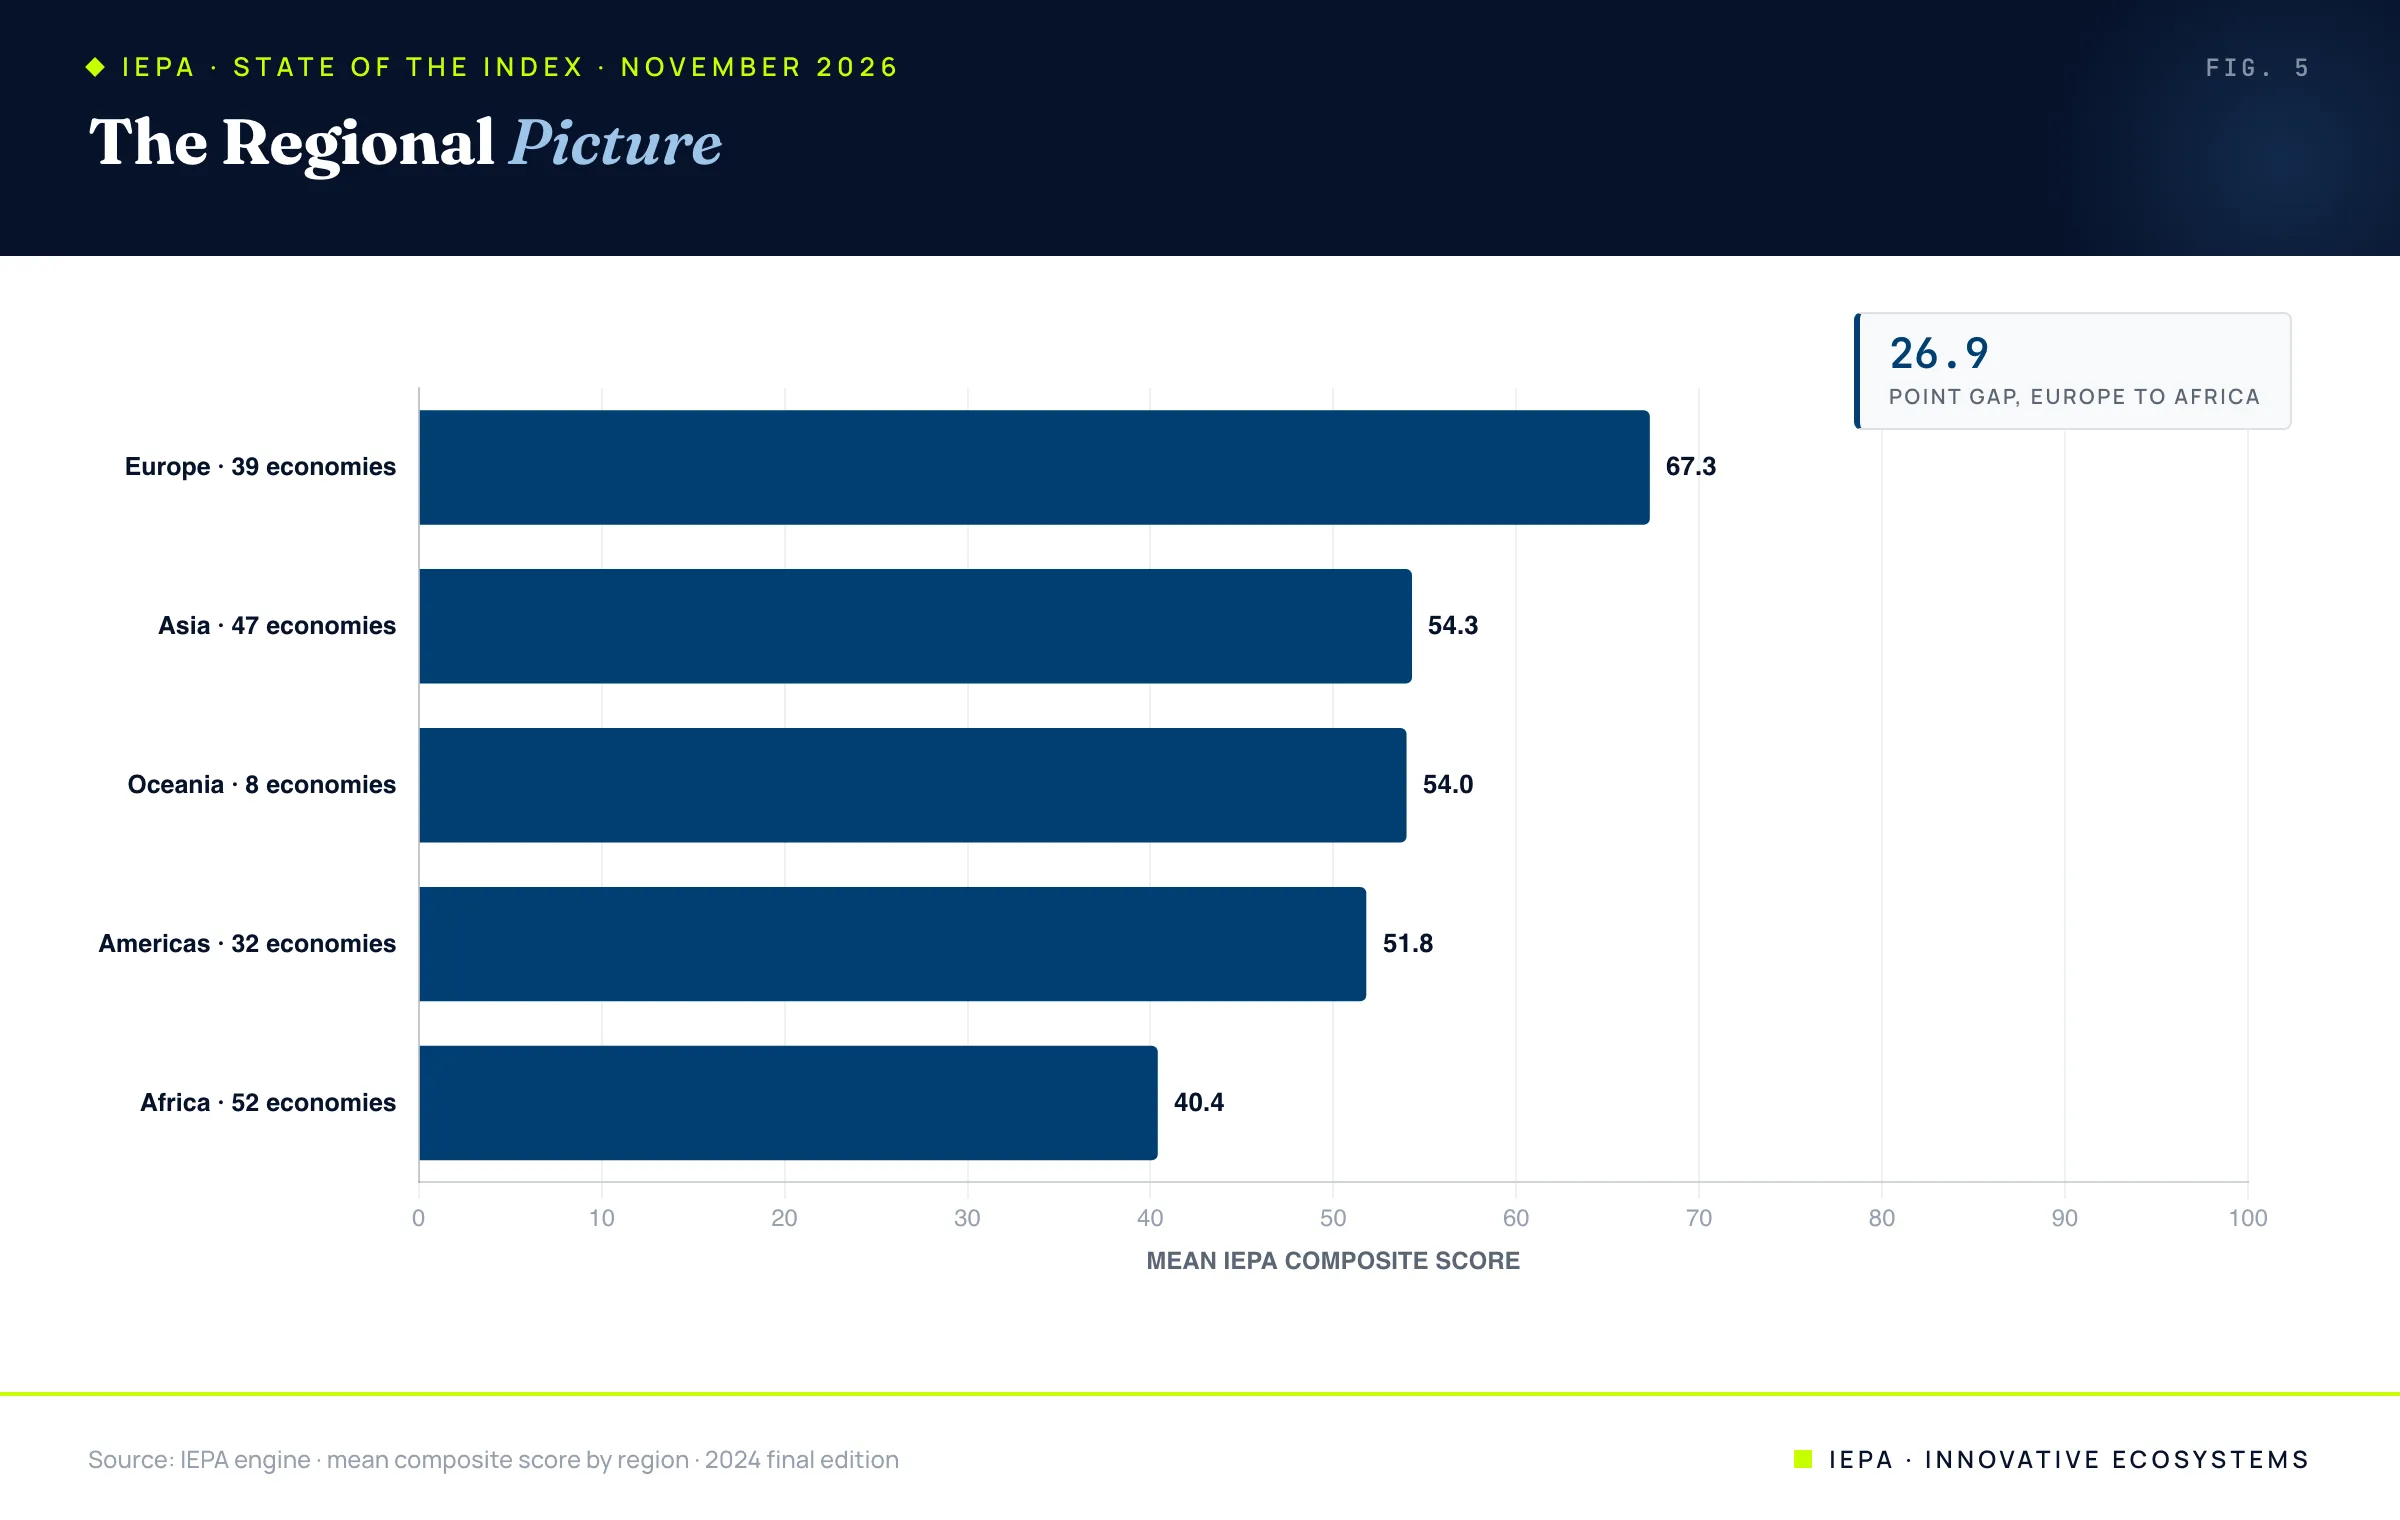
Europe leads on the mean by thirteen points and has gained the most since 2010. Africa has the lowest mean and the smallest gain. It is also the only region where the FDI accelerator is the strongest input zone, with innovation capacity the weakest by fourteen points. Capital is arriving ahead of the capability that would let it compound.
07We Tested Our Own Headline
The June edition was built around one claim, which we called the Balance Premium: that an economy's realized prosperity tracks its weakest zone more closely than its strongest. It is the country-scale version of a well-known idea, the O-Ring theory, in which the weakest component of a production process caps the value of all the others. On 117 economies the data supported it, narrowly.
On the rebuilt Index the support is gone. Across all 178 economies, prosperity outcomes correlate 0.67 with the weakest of the five input zones and 0.65 with the strongest. That is a difference too small to carry a thesis, and it reverses among the 124 economies with Solid confidence, where the strongest zone is the better predictor (0.63 against 0.59). The decisive test is to put the weakest zone and the average level in the same equation:
So we are retiring the claim as stated. What the rebuilt Index supports is simpler and, for a policymaker, harder: prosperity follows the overall level of the foundations. One point on the average of innovation capacity, entrepreneurship capacity, resilience, alignment and the FDI accelerator is associated with 0.69 points of prosperity. That average alone explains 52% of the variation in prosperity outcomes.
One part of the June argument does survive. No single zone carries prosperity by itself, and the one most often treated as a shortcut carries it least. Taken alone, entrepreneurship capacity correlates 0.72 with prosperity, innovation capacity 0.69, resilience and alignment 0.68 each. The FDI accelerator correlates 0.33. Attracting capital is the zone a government can move fastest, and by itself it says the least about whether prosperity follows.
The zone a government can move fastest is the one that says the least about whether prosperity follows.
08Who Converts, and Who Does Not
The line in Figure 6 gives every economy an expected level of prosperity for its foundations. The distance from that line is the more interesting number. Economies above it are realizing more prosperity than their foundations predict. Economies below it are realizing less.
| Above the line | Points above | Below the line | Points below |
|---|---|---|---|
| Russia | +27.5 | South Africa | -24.4 |
| Macao | +26.1 | State of Palestine | -22.4 |
| Qatar | +23.9 | Jordan | -18.9 |
| Kazakhstan | +20.8 | Sao Tome and Principe | -18.7 |
| Belarus | +20.7 | Afghanistan | -18.4 |
| Bermuda | +20.0 | Lebanon | -18.2 |
| Brunei | +19.6 | Mozambique | -17.0 |
| Turkmenistan | +19.3 | Sudan | -16.8 |
| UAE | +18.4 | Tunisia | -16.8 |
| Bhutan | +17.4 | Morocco | -16.5 |
The list above the line is dominated by hydrocarbon exporters and specialized rent economies: Russia, Qatar, Kazakhstan, Brunei, Turkmenistan and the UAE on energy, Macao on gaming, Bermuda on financial services. Their measured prosperity is real. It is also larger than their foundations would produce without the rent, which is the exposure the resource-curse literature has documented for three decades. The UAE shows the margin at work: its input zones average 67.9, 34th in the field, and a prosperity score of 84.9 lifts it to tenth on the composite.
The list below the line matters more to the people who run development strategy. South Africa, Jordan, Tunisia and Morocco all carry foundations in the middle of the field, ranked between 64th and 82nd on the average of their input zones, and prosperity outcomes sixteen to twenty-four points beneath what those foundations predict. These are economies that have built capability and are still waiting for it to pay. The Index cannot say why from the composite alone. It can say where to look: each of these market pages shows which outcome measures are holding the zone down.
09No Convergence
The June edition reported convergence in the middle of the distribution and a stall at the top. The second half of that finding does not hold on the rebuilt Index, and the first half needs restating. The standard test regresses each economy's change since 2010 on its starting score. A negative slope means the economies that started behind are catching up.
| Starting quartile, 2010 | Mean score in 2010 | Mean change to 2024 | Share that rose |
|---|---|---|---|
| Lowest | 34.6 | +1.5 | 56% |
| Second | 45.2 | +2.3 | 67% |
| Third | 54.3 | +2.9 | 64% |
| Highest | 68.5 | +1.7 | 73% |
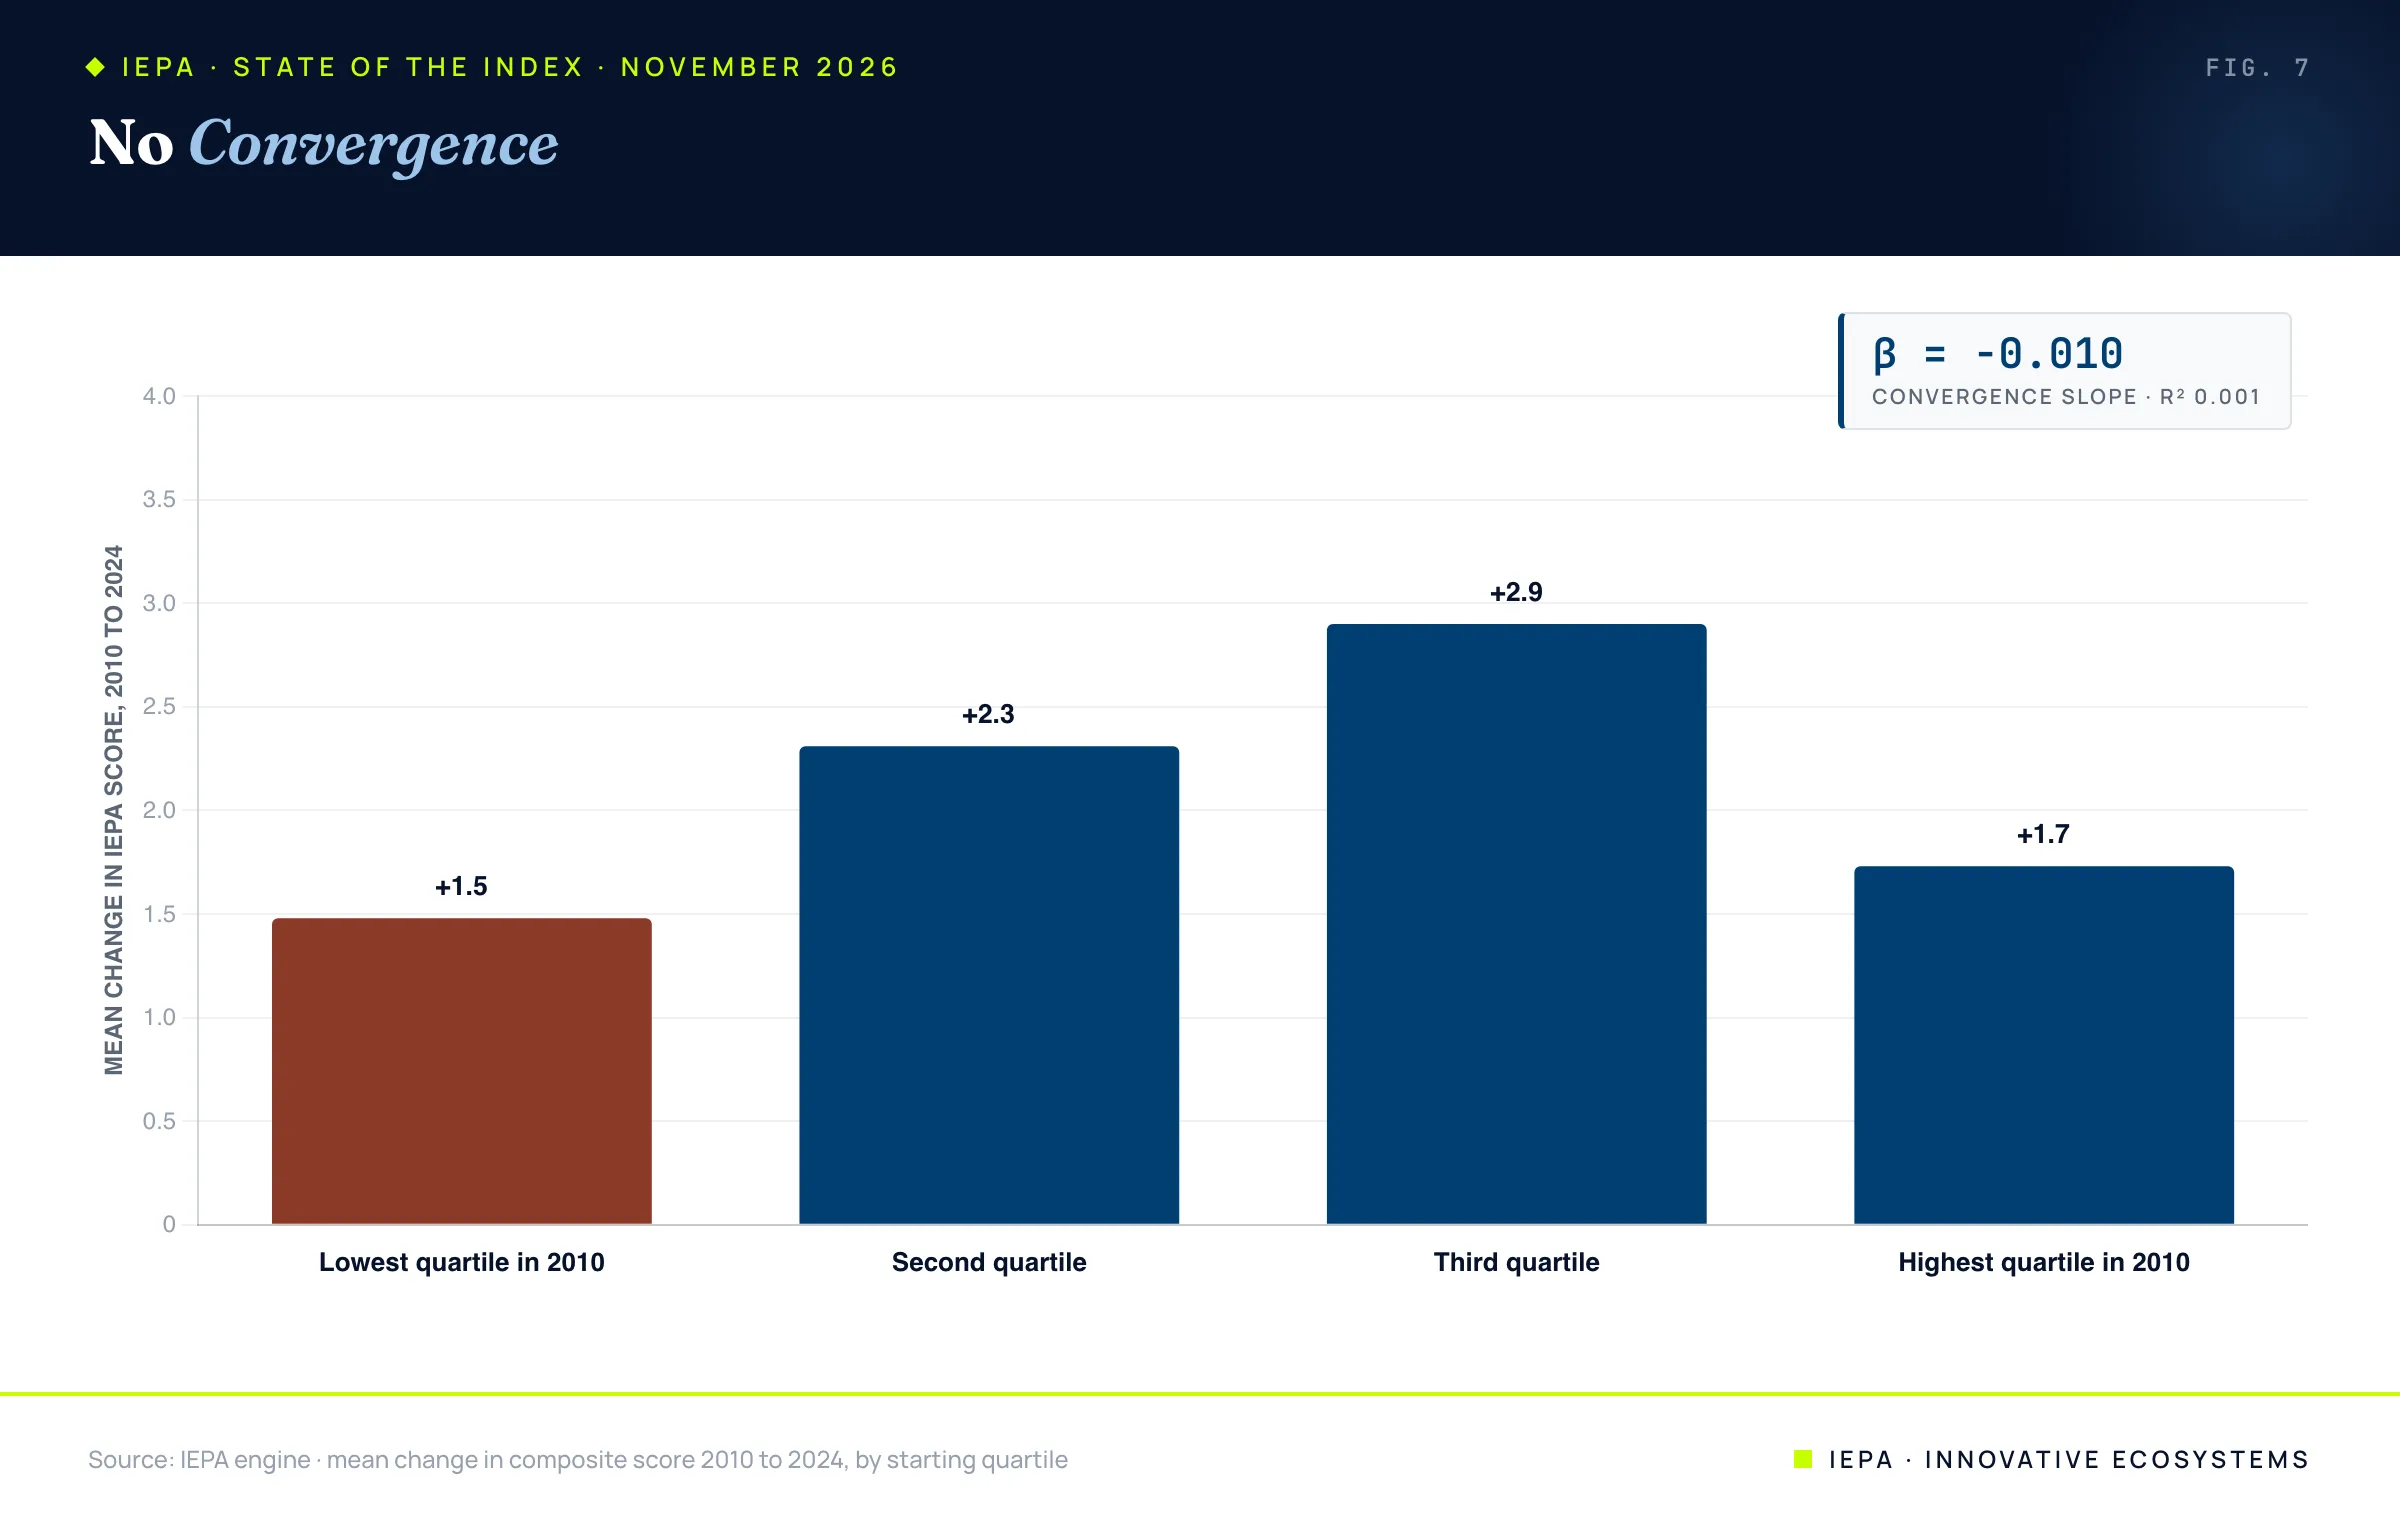
The middle of the field gained the most, the top kept rising, and the bottom gained the least. Twenty of the 45 economies in the lowest quartile of 2010 score lower today than they did then. The gap between the mean of the top decile and the mean of the bottom decile widened from 44.0 points to 45.5, and the standard deviation of the whole field rose from 13.1 to 14.0.
This sits awkwardly beside the best recent evidence on incomes, which finds that poorer countries have been catching up on income per head since the mid-1990s. Both can be true. Income can converge on commodity prices, remittances and capital inflows while the foundations that sustain it stand still. On the evidence of this Index, the foundations of the lowest-ranked economies are where the older story of divergence still applies. A government looking at rising income and flat foundations is looking at growth that has not been secured.
The lowest quartile also holds the most useful exceptions in the Index. Senegal (+13.4), Djibouti (+12.8), Uzbekistan (+9.8), Rwanda (+9.7) and the Gambia (+9.5) all started in it and are among the largest gainers in the Index.
10What This Edition Says
- Raise the level. Prosperity moves with the average of the foundations. The data offers no shortcut through a single strong zone and no special penalty for a single weak one.
- Capital is the least reliable signal. The FDI accelerator is the zone most often weakest (70 of 178 economies), the zone behind most of the large swings in either direction, and the zone least correlated with prosperity when taken alone.
- Read rent as rent. The economies furthest above the prosperity line are mostly living on a resource or a specialized service. The ones using that margin to build foundations are the ones climbing the composite.
- The bottom needs a different conversation. There is no automatic catch-up in the foundations. The lowest quartile gained least, and almost half of it went backward.
- The top is stable and crowded. Seventeen of twenty leaders have held their place for fourteen years, and nine economies sit within two points of each other behind Singapore and Denmark.
11How to Read This Index
The IEPA scores six zones. Five are inputs: innovation capacity, entrepreneurship capacity, resilience, alignment and the FDI accelerator. The sixth, prosperity outcomes, is the result those inputs are meant to produce. The composite combines all six, and it is always published beside the zone scores. The full method is on the methodology page.
Scores in this report are from the 2024 final edition, the most recent year we treat as complete. Scores for 2025 and 2026 exist on every market page as current estimates and will firm up as their evidence arrives. Because much of the Index is relative to the field, a score is best read as a position among 178 economies in a given year, and comparisons across time should be made within one edition of the Index.
Methods and limits. All figures are computed from the live IEPA engine on the 2024 final edition unless a year is stated. Correlations are Pearson. Regressions are ordinary least squares on 178 economies with no weighting. The five input zones are innovation capacity, entrepreneurship capacity, resilience, alignment and the FDI accelerator; the weakest and strongest zone for an economy are the minimum and maximum of those five. Quartiles and deciles are formed on 2010 composite scores. Associations reported here are descriptive and do not establish cause. This edition replaces the numbers in the June 2026 edition, which remains published as originally written.
- Innovative EcoSystems (June 2026). State of the Index 2026, the first edition of this report.
- Kremer, M. (1993). The O-Ring Theory of Economic Development. Quarterly Journal of Economics, 108(3), 551-575.
- Barro, R. J., & Sala-i-Martin, X. (1992). Convergence. Journal of Political Economy, 100(2), 223-251.
- Pritchett, L. (1997). Divergence, Big Time. Journal of Economic Perspectives, 11(3), 3-17.
- Patel, D., Sandefur, J., & Subramanian, A. (2021). The New Era of Unconditional Convergence. Journal of Development Economics, 152.
- Sachs, J. D., & Warner, A. M. (1995). Natural Resource Abundance and Economic Growth. NBER Working Paper 5398.
- Innovative EcoSystems. The IEPA Methodology.
The Honest Empty
For seven economies our own engine assessed over four hundred products each and returned nothing. The emptiness is the diagnosis, so we ship it.
→Explore the IEPA
Six zones, every market this research is scored from.
→Open the Atlas
The live global registry this research is drawn from.
→