State of the Index 2026
The annual IEPA assessment of 117 economies, and a test of the claim that balance beats brilliance
This is the first annual State of the Index from Innovative EcoSystems, reporting where the world's economies stand on the IEPA composite, a six-zone measure of competitiveness scored across 117 economies, 99 underlying indices, and 15 years of history. It is also the first to test the report's central claims rather than assert them. The headline of 2026 is not a winner; it is a structure. Prosperity belongs to balanced economies, and we can now prove it. The realized prosperity of an economy correlates more tightly with its weakest input zone than with its strongest, a macro-scale instance of the weakest-link logic that the O-Ring theory of development formalized for the firm. Separately, a convergence test confirms genuine catch-up in the middle of the distribution and a stall at the top.
- The field is tightly packed. Mean IEPA 52.2, median 52.0, standard deviation 13.9; only five economies clear 75.
- The curated leaderboard is led by Singapore and the United States (76.7 and 71.0). Singapore leads without owning a single input zone, the Balance Premium in one economy.
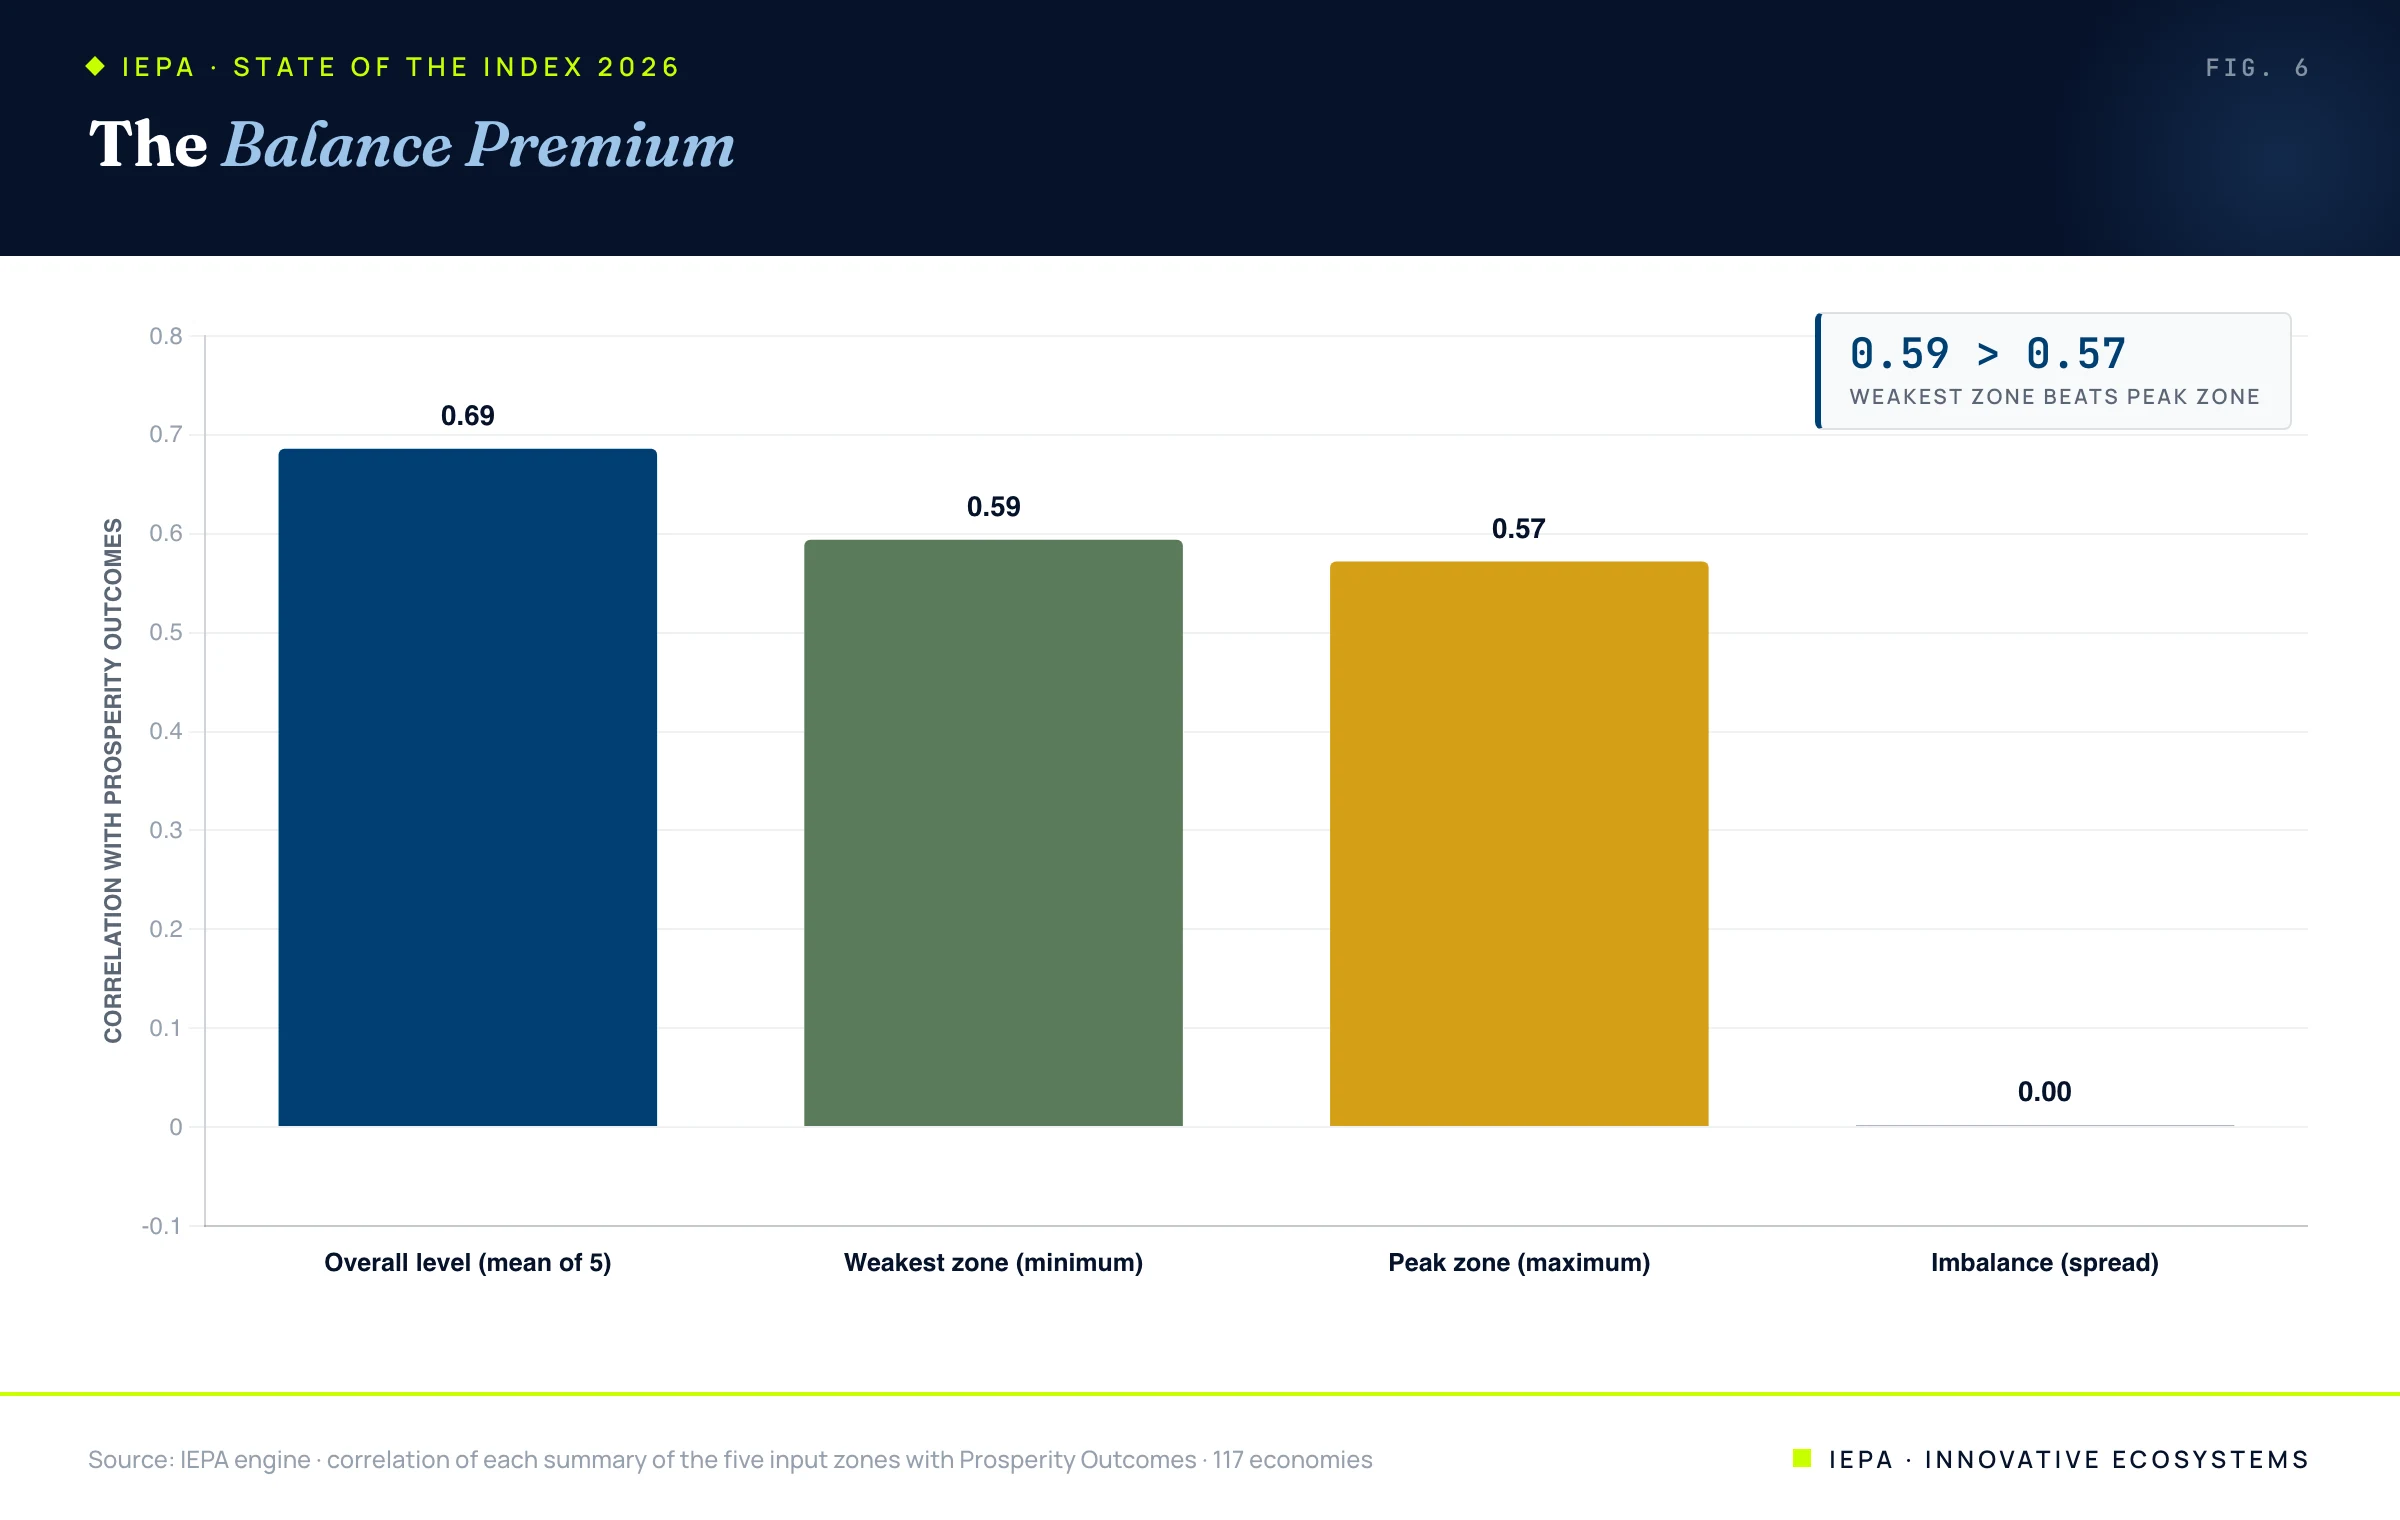
- Balance beats brilliance, measured. Prosperity correlates 0.59 with an economy's weakest zone and only 0.57 with its strongest. The floor predicts the outcome better than the ceiling.
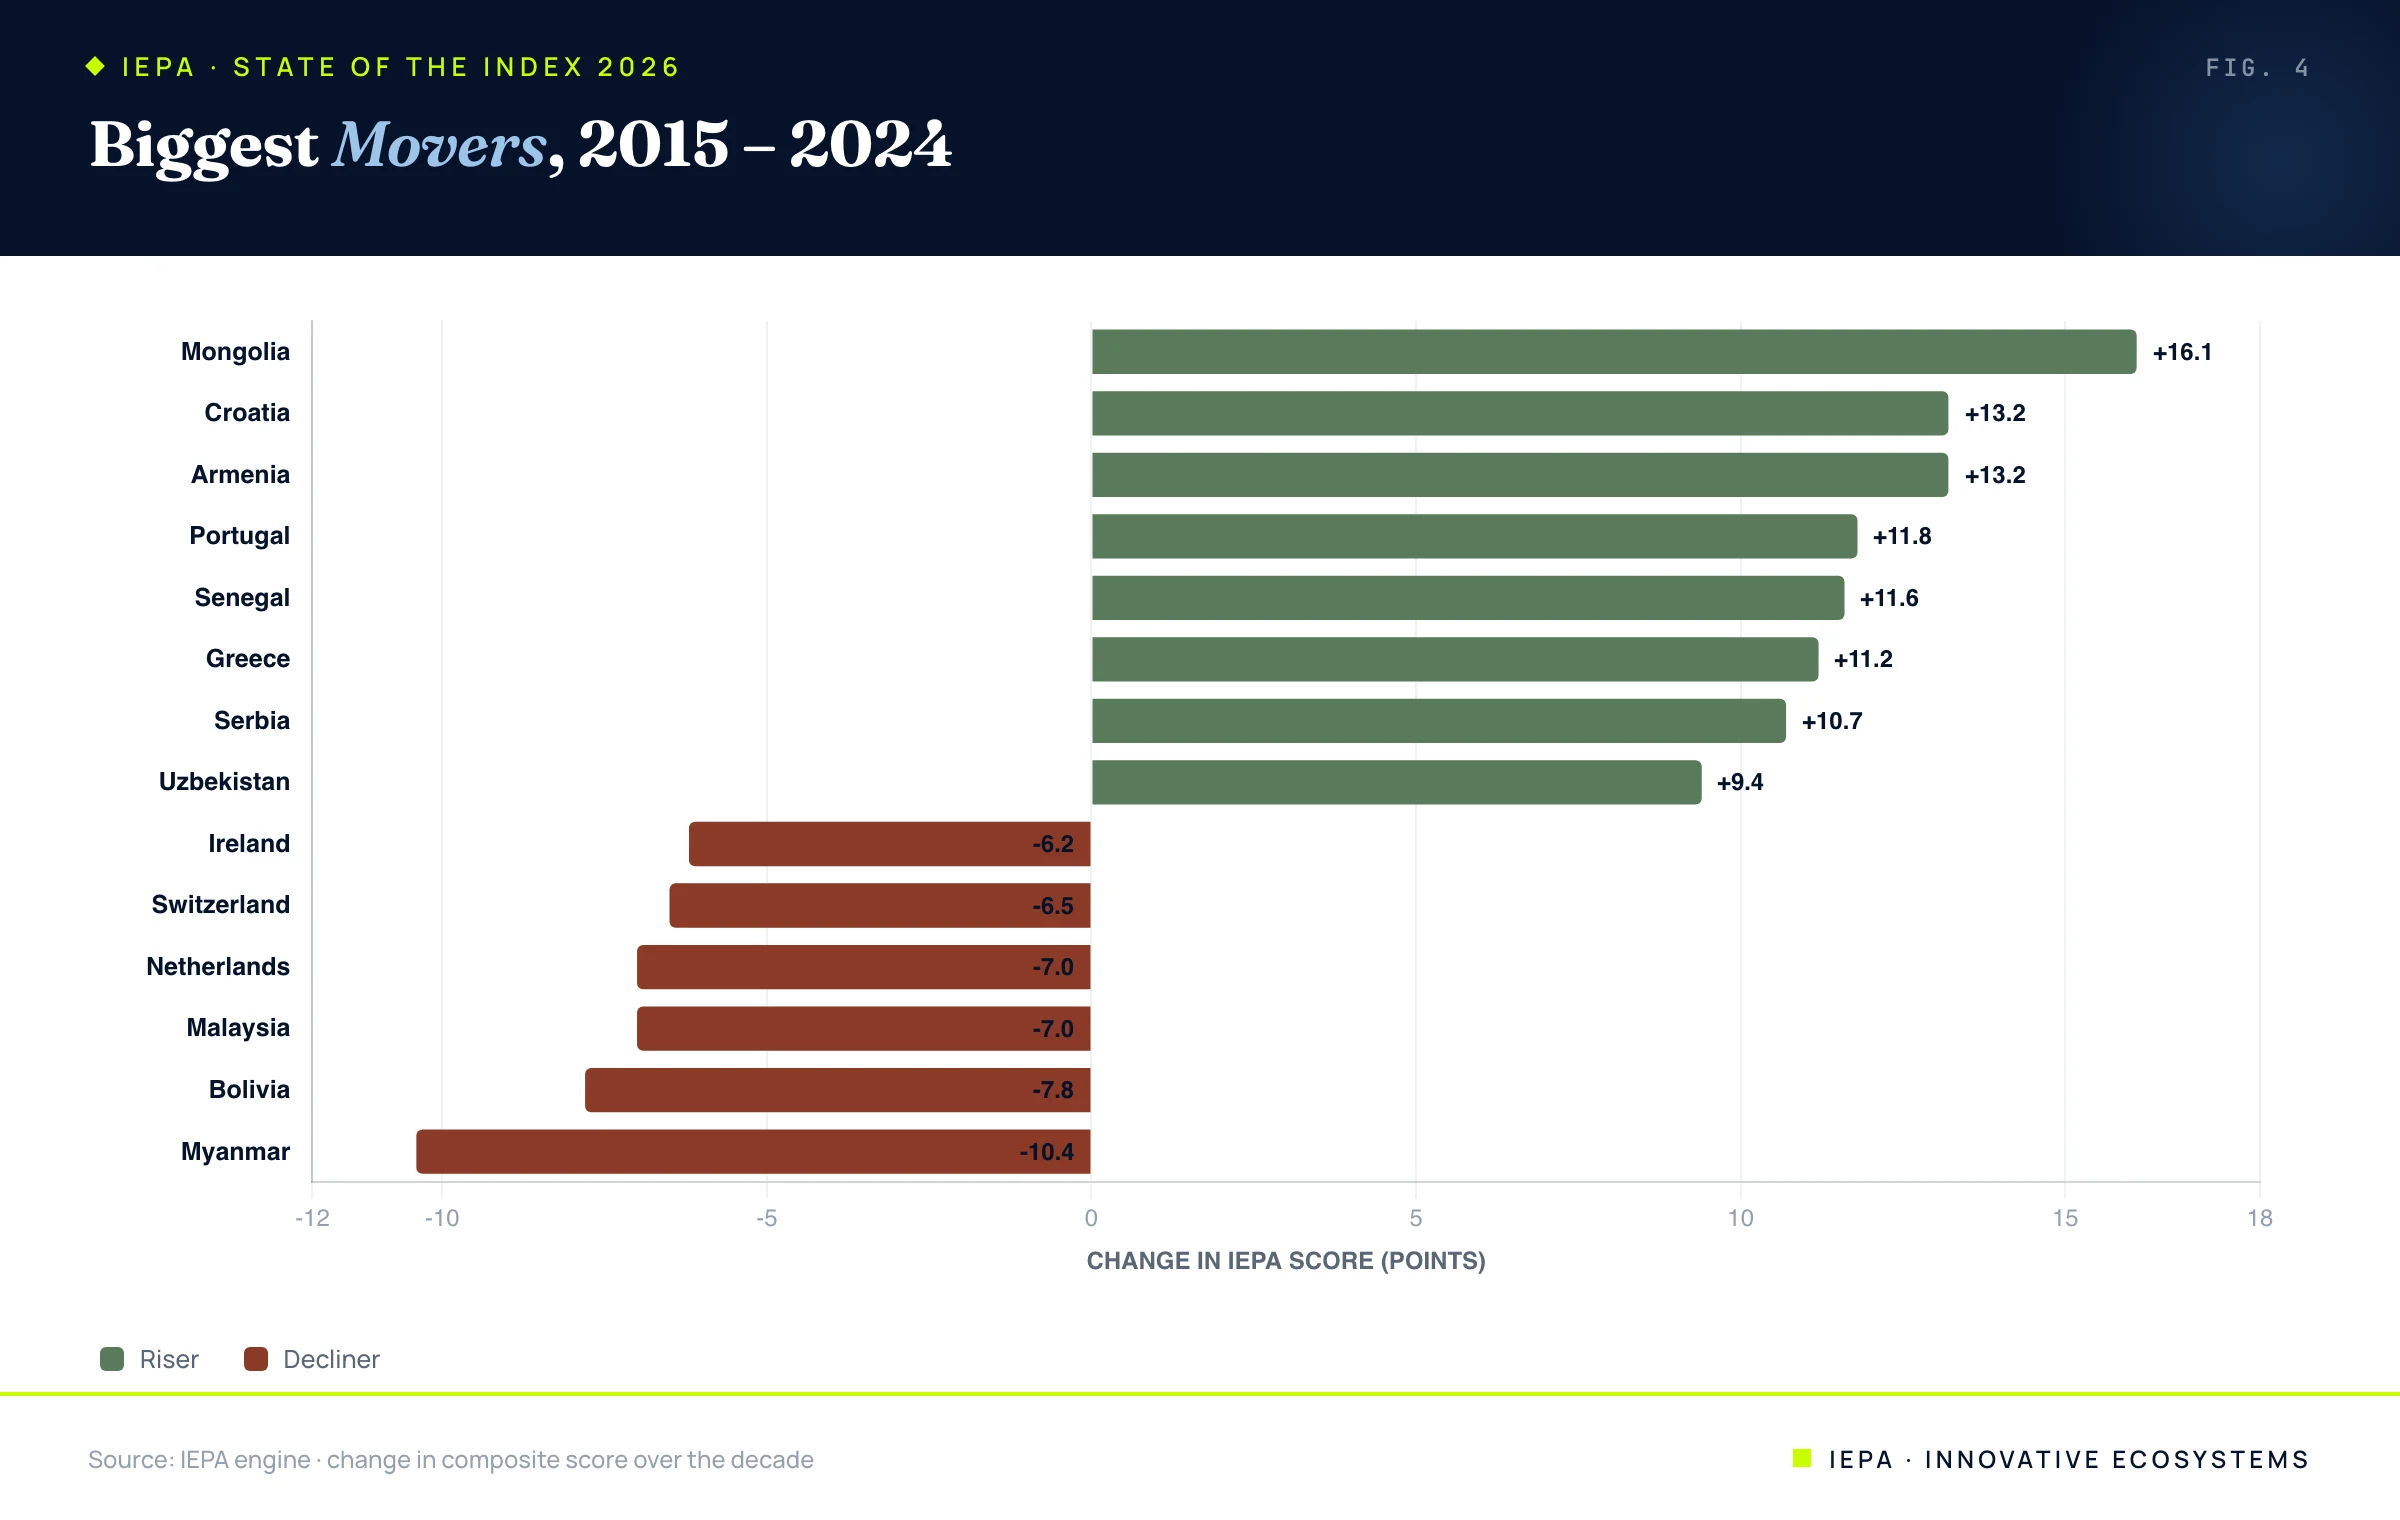
- Convergence is real but slow, and the frontier is not safe. The upper-middle quartile gained most over the decade (+4.0); the advanced quartile stalled (+0.6), with the Netherlands, Switzerland, and Ireland each shedding six-plus points.
01The Field at a Glance
The 2026 IEPA field is a tightly clustered distribution with a long way still to climb. The mean score across all 117 economies is 52.2, the median is 52.0, and the standard deviation is 13.9. The lowest-scoring economy sits at 26.4 and the highest raw score reaches 80.1, but the mass of the world is bunched in the middle.
| IEPA score band | Economies |
|---|---|
| 25 to 35 | 15 |
| 35 to 45 | 28 |
| 45 to 55 | 25 |
| 55 to 65 | 22 |
| 65 to 75 | 22 |
| 75 and above | 5 |
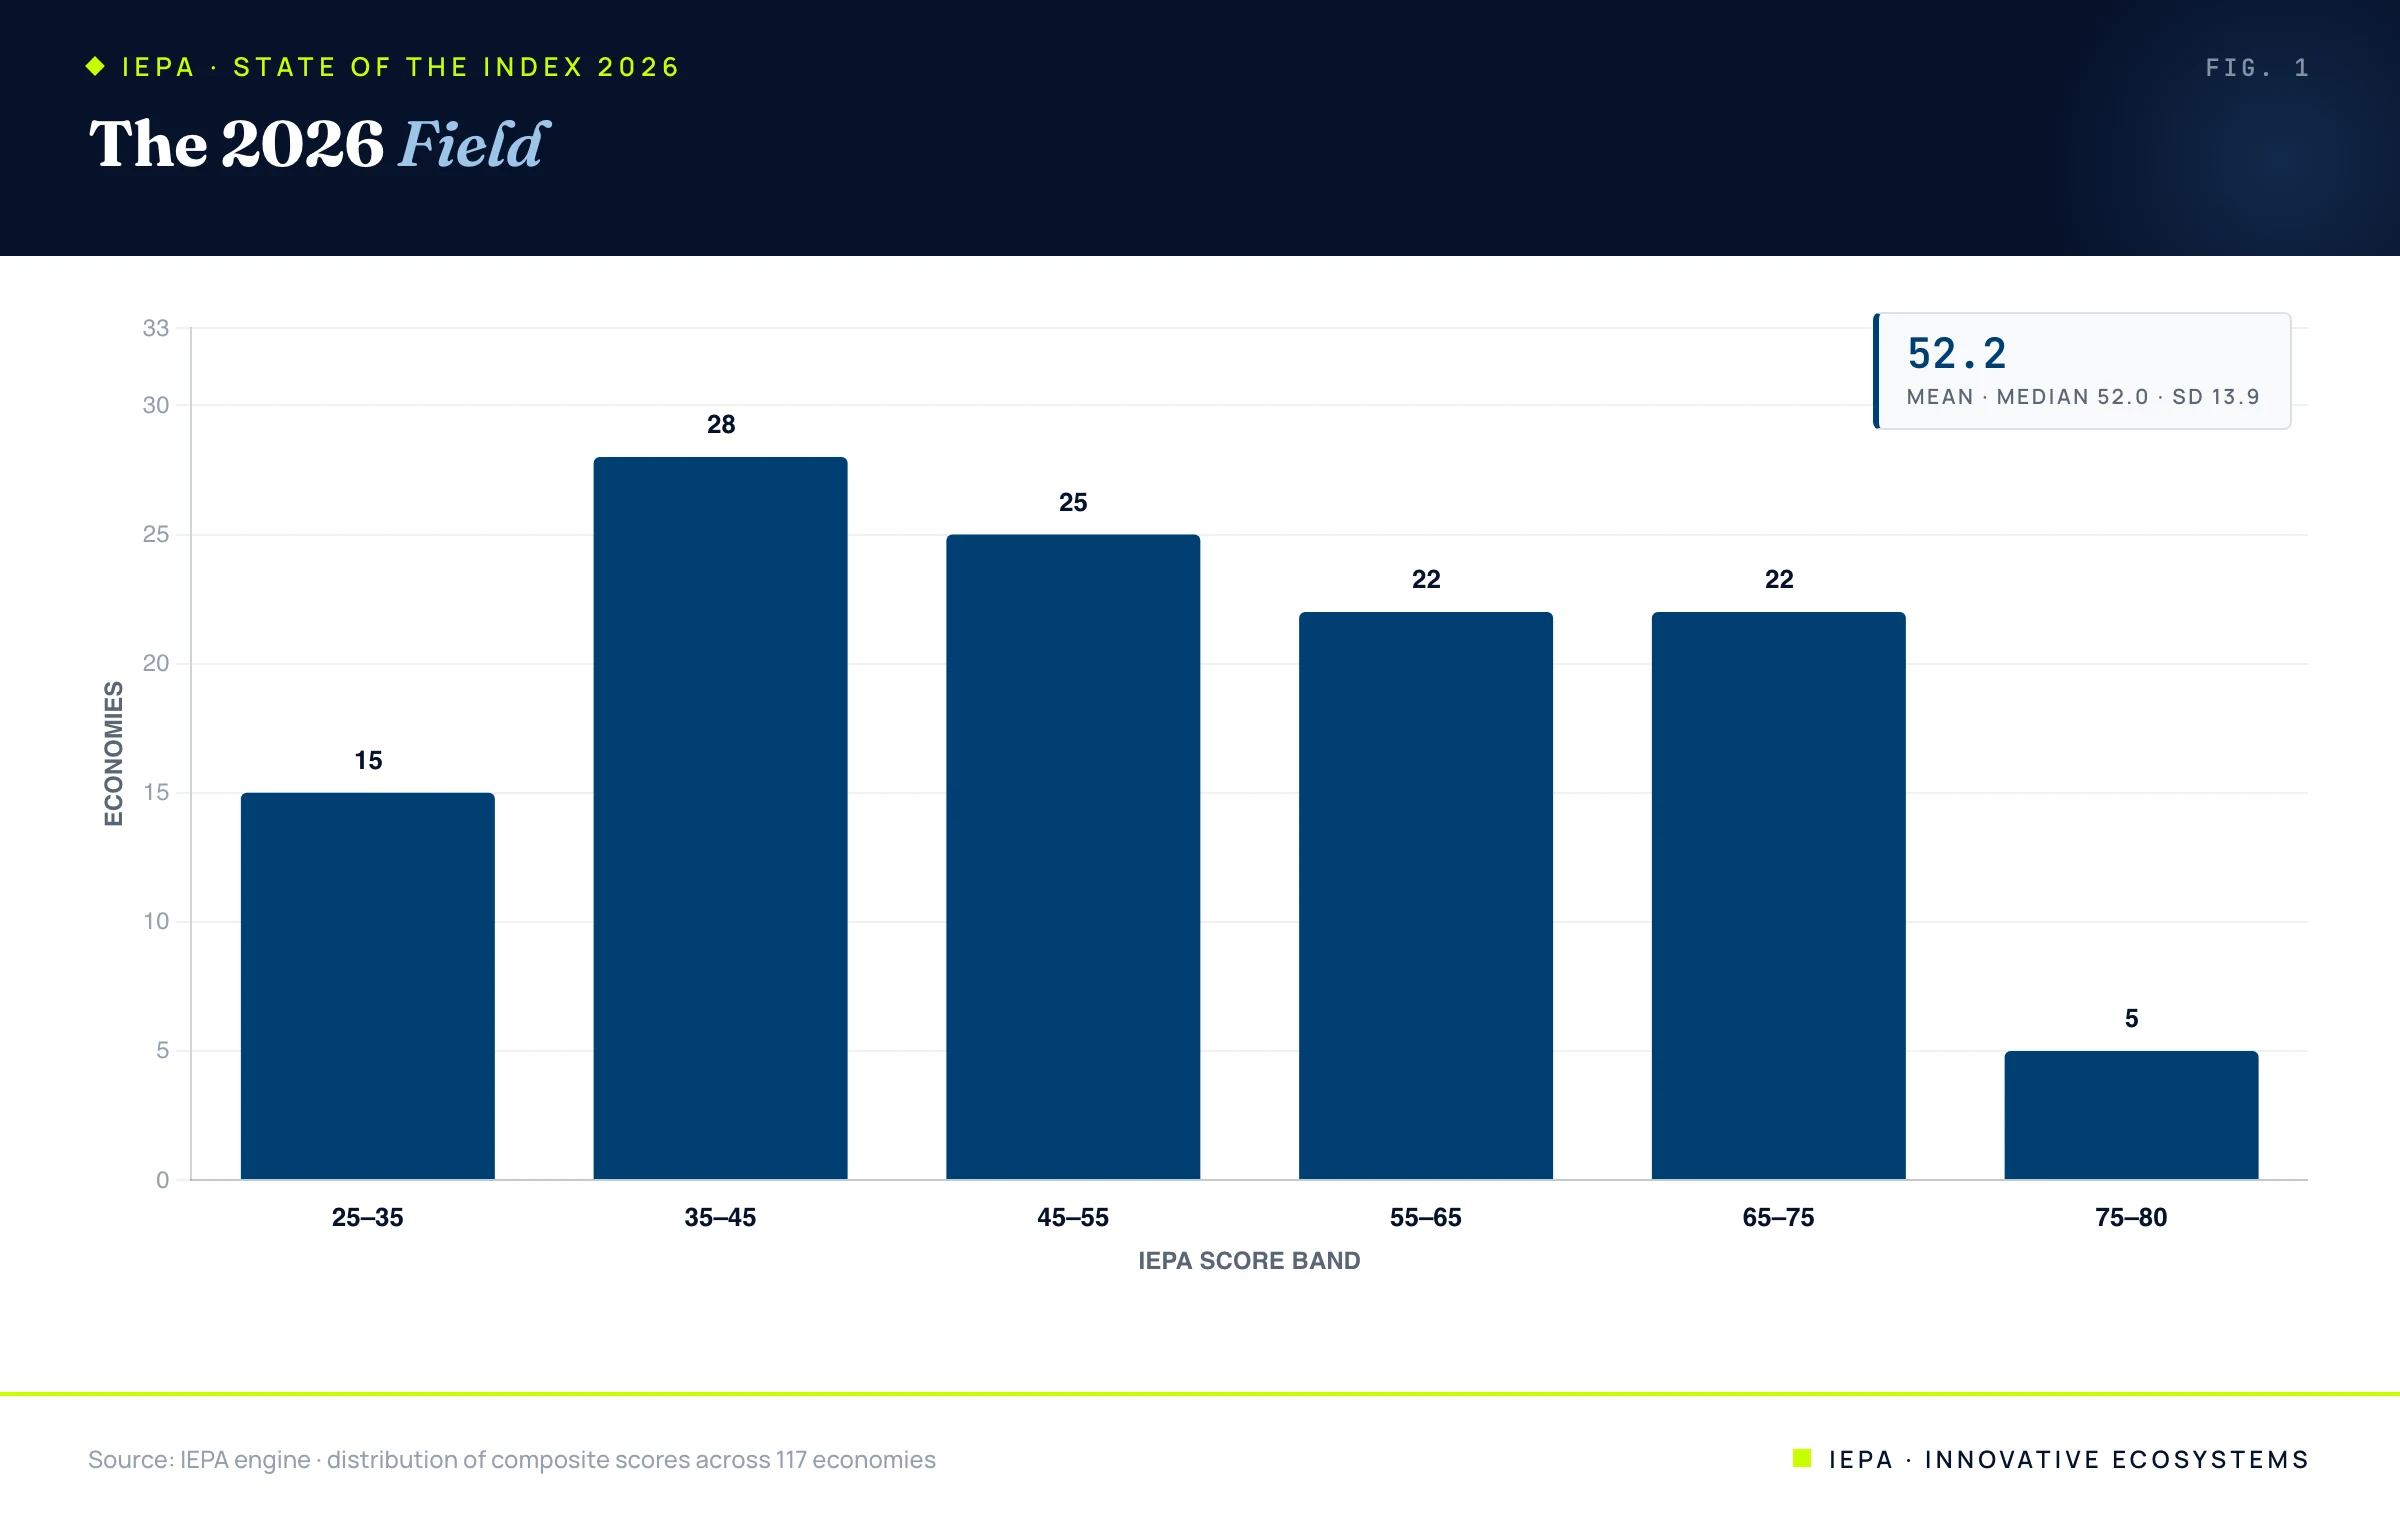
The shape matters. The single largest cluster, 28 of 117, scores between 35 and 45. Prosperity, measured honestly across six zones, is rare and hard-won. Most of the world is in the broad middle, with one or two strong zones and at least one that is holding it back. That middle is precisely where regional intervention has the most leverage, and it is the market Innovative EcoSystems is built to serve.
02The 2026 Leaderboard
IEPA publishes two readings of the top of the table, and the difference between them is the discipline of the index. The curated leaderboard ranks only high-confidence economies, those scored on enough deep, reliable data to stand behind without caveat.
| Rank | Economy | IEPA | Confidence | Tier |
|---|---|---|---|---|
| 1 | Singapore | 76.7 | 0.90 | Benchmark |
| 2 | United States | 71.0 | 0.90 | Benchmark |
| 3 | United Arab Emirates | 68.4 | 0.89 | Tier 1 |
| 4 | Finland | 64.9 | 0.90 | Benchmark |
| 5 | Germany | 64.6 | 0.90 | Benchmark |
| 6 | South Korea | 64.2 | 0.90 | Tier 1 |
| 7 | Israel | 62.2 | 0.90 | Benchmark |
| 8 | Malaysia | 59.6 | 0.91 | Tier 1 |
| 9 | Thailand | 55.0 | 0.91 | Tier 1 |
| 10 | Vietnam | 54.4 | 0.91 | Tier 1 |
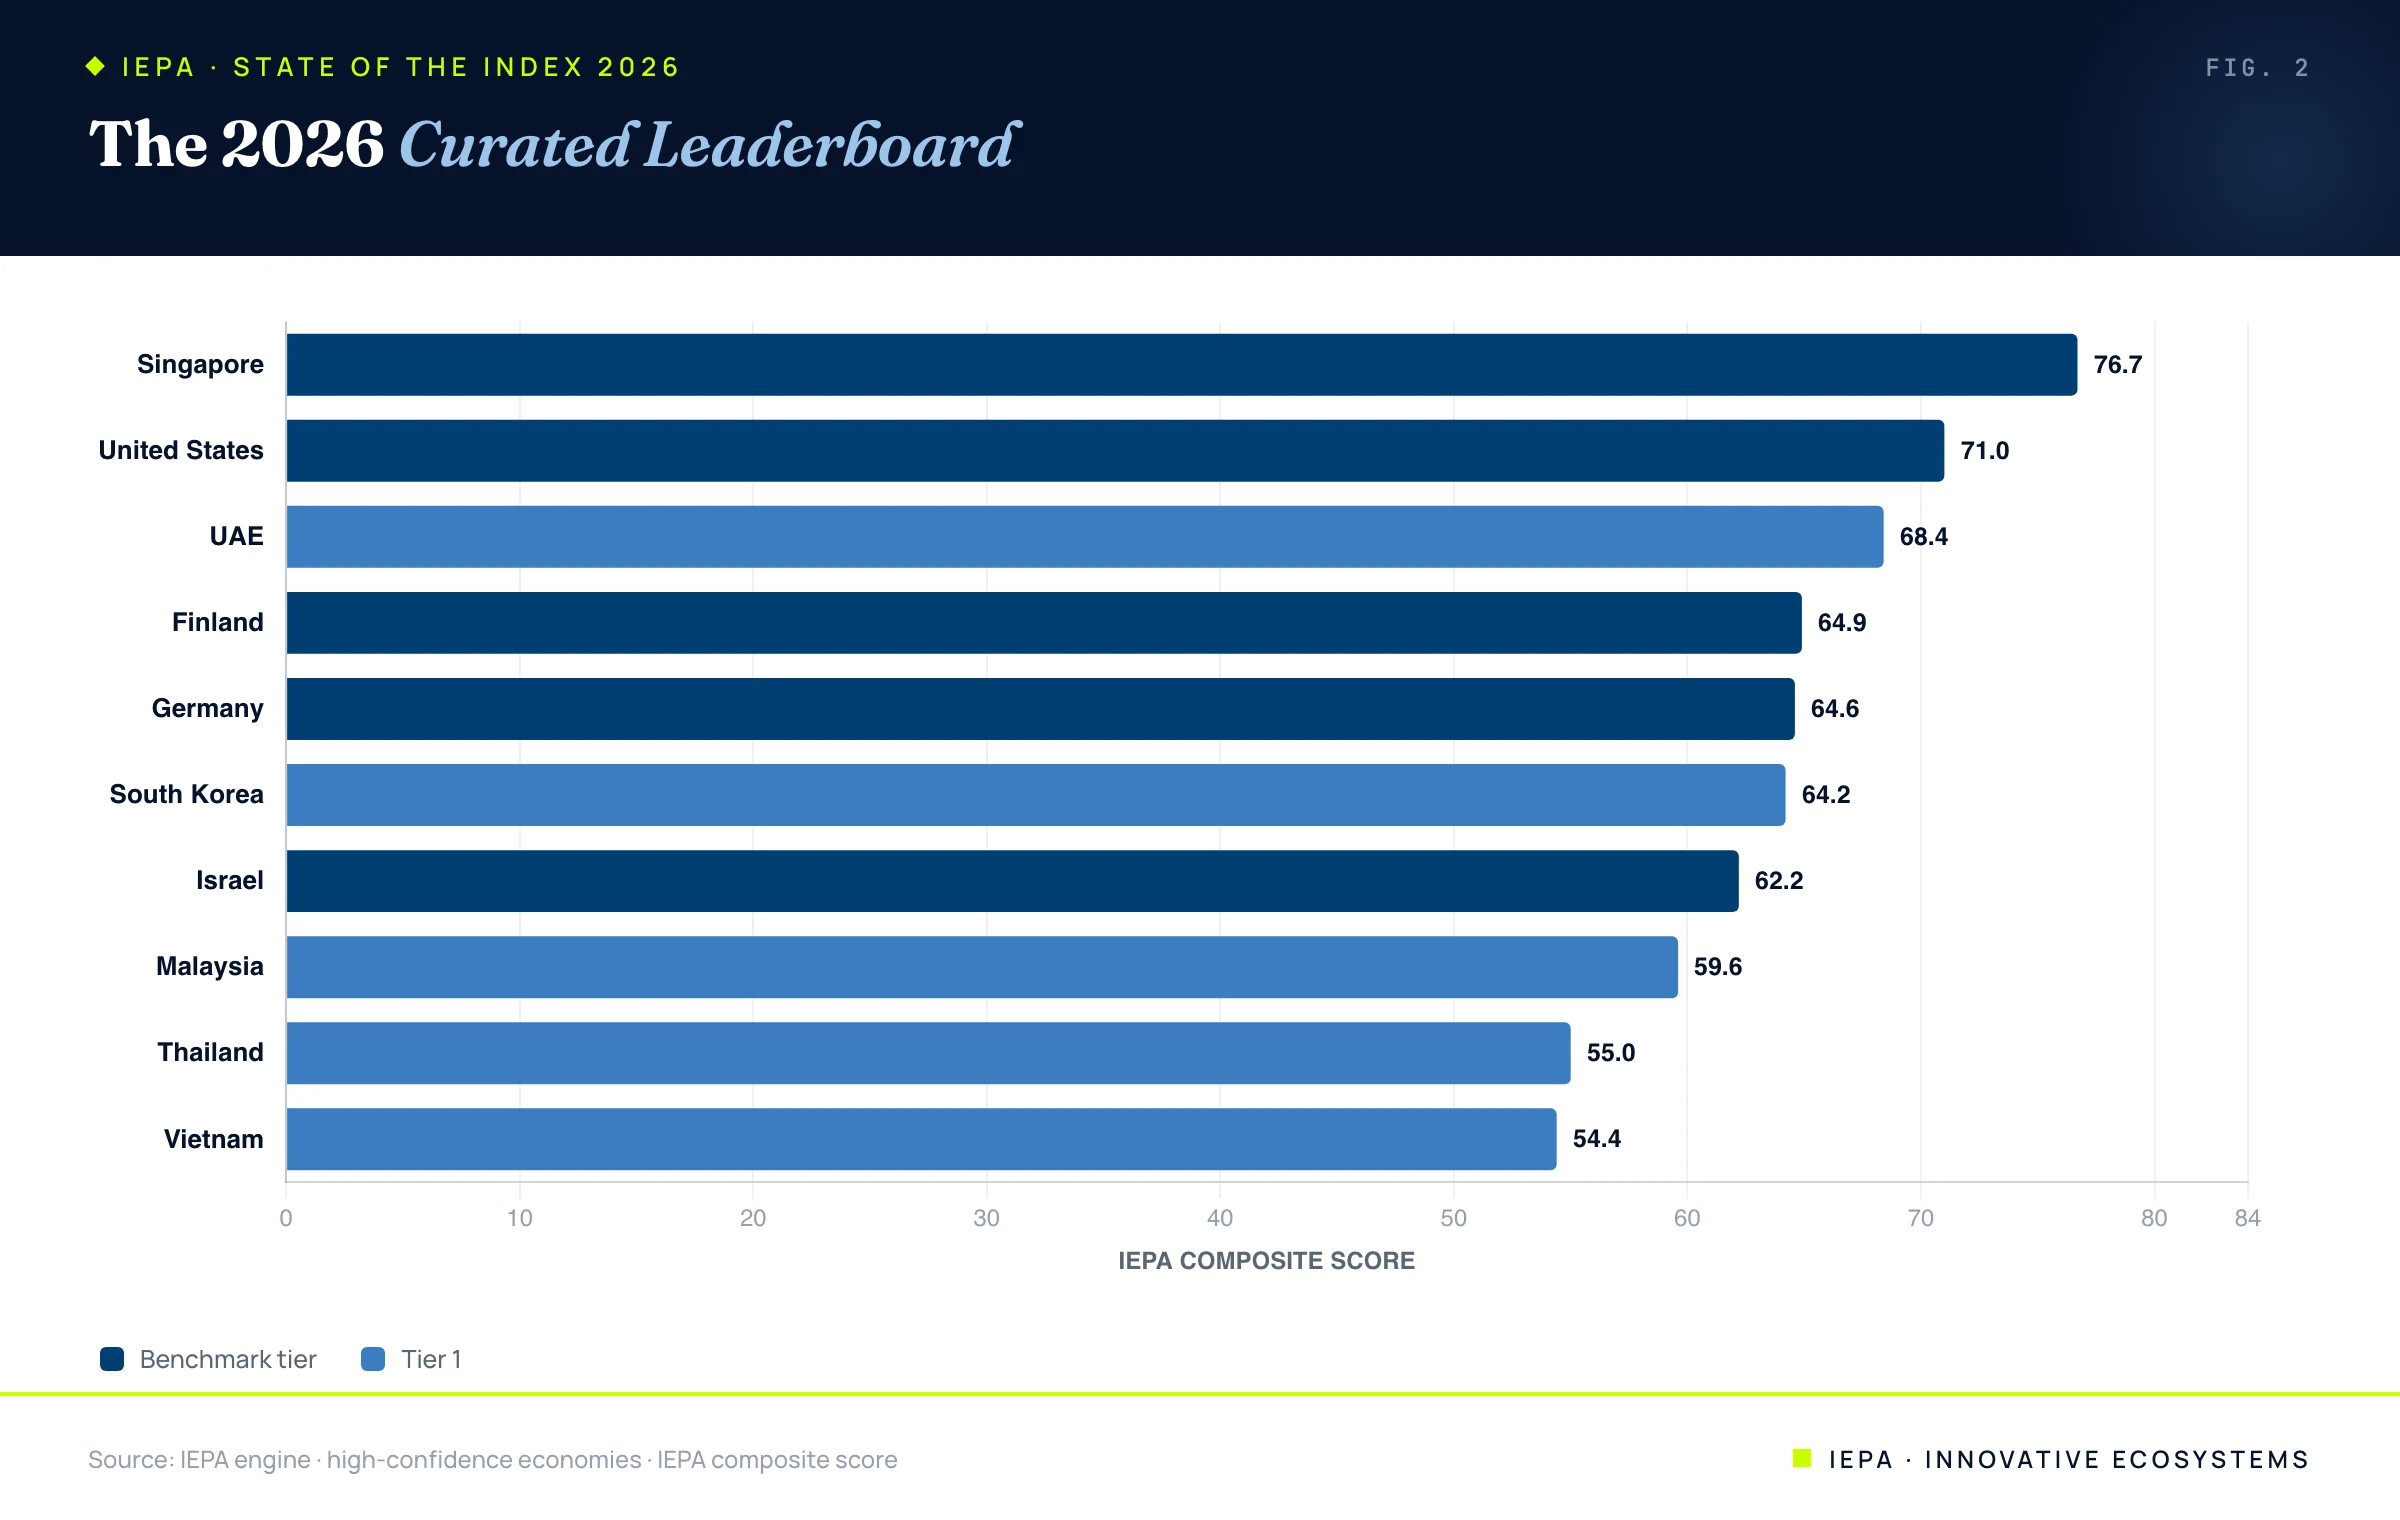
Singapore is the 2026 benchmark economy. It does not lead any single input zone outright, but it is excellent across all of them and owns Prosperity Outcomes at 86.6. Hold that fact; Section 6 explains why it is not a coincidence. The raw field tells a different story: before curation, Denmark posts the highest composite at 80.1 and Hong Kong second at 77.8, but both sit at Extended-tier confidence near 0.74, and Hong Kong carries the conduit distortion documented in our FDI Paradox paper. IEPA shows both readings, labels the confidence, and leads with the board it can defend.
03Zone Champions
No economy leads all six zones. The 2026 champions are spread across the Nordics, North America, and Asia.
| Zone | Champion | Score | Runners-up |
|---|---|---|---|
| Innovation Capacity | Sweden | 88.8 | UK, Austria |
| Entrepreneurship | United States | 92.0 | Switzerland, UK |
| Resilience | Finland | 85.7 | Sweden, Norway |
| Alignment | Denmark | 90.6 | Norway, Sweden |
| FDI Accelerator | Hong Kong | 97.2 | Malta, Luxembourg |
| Prosperity Outcomes | Singapore | 86.6 | UAE, Malta |
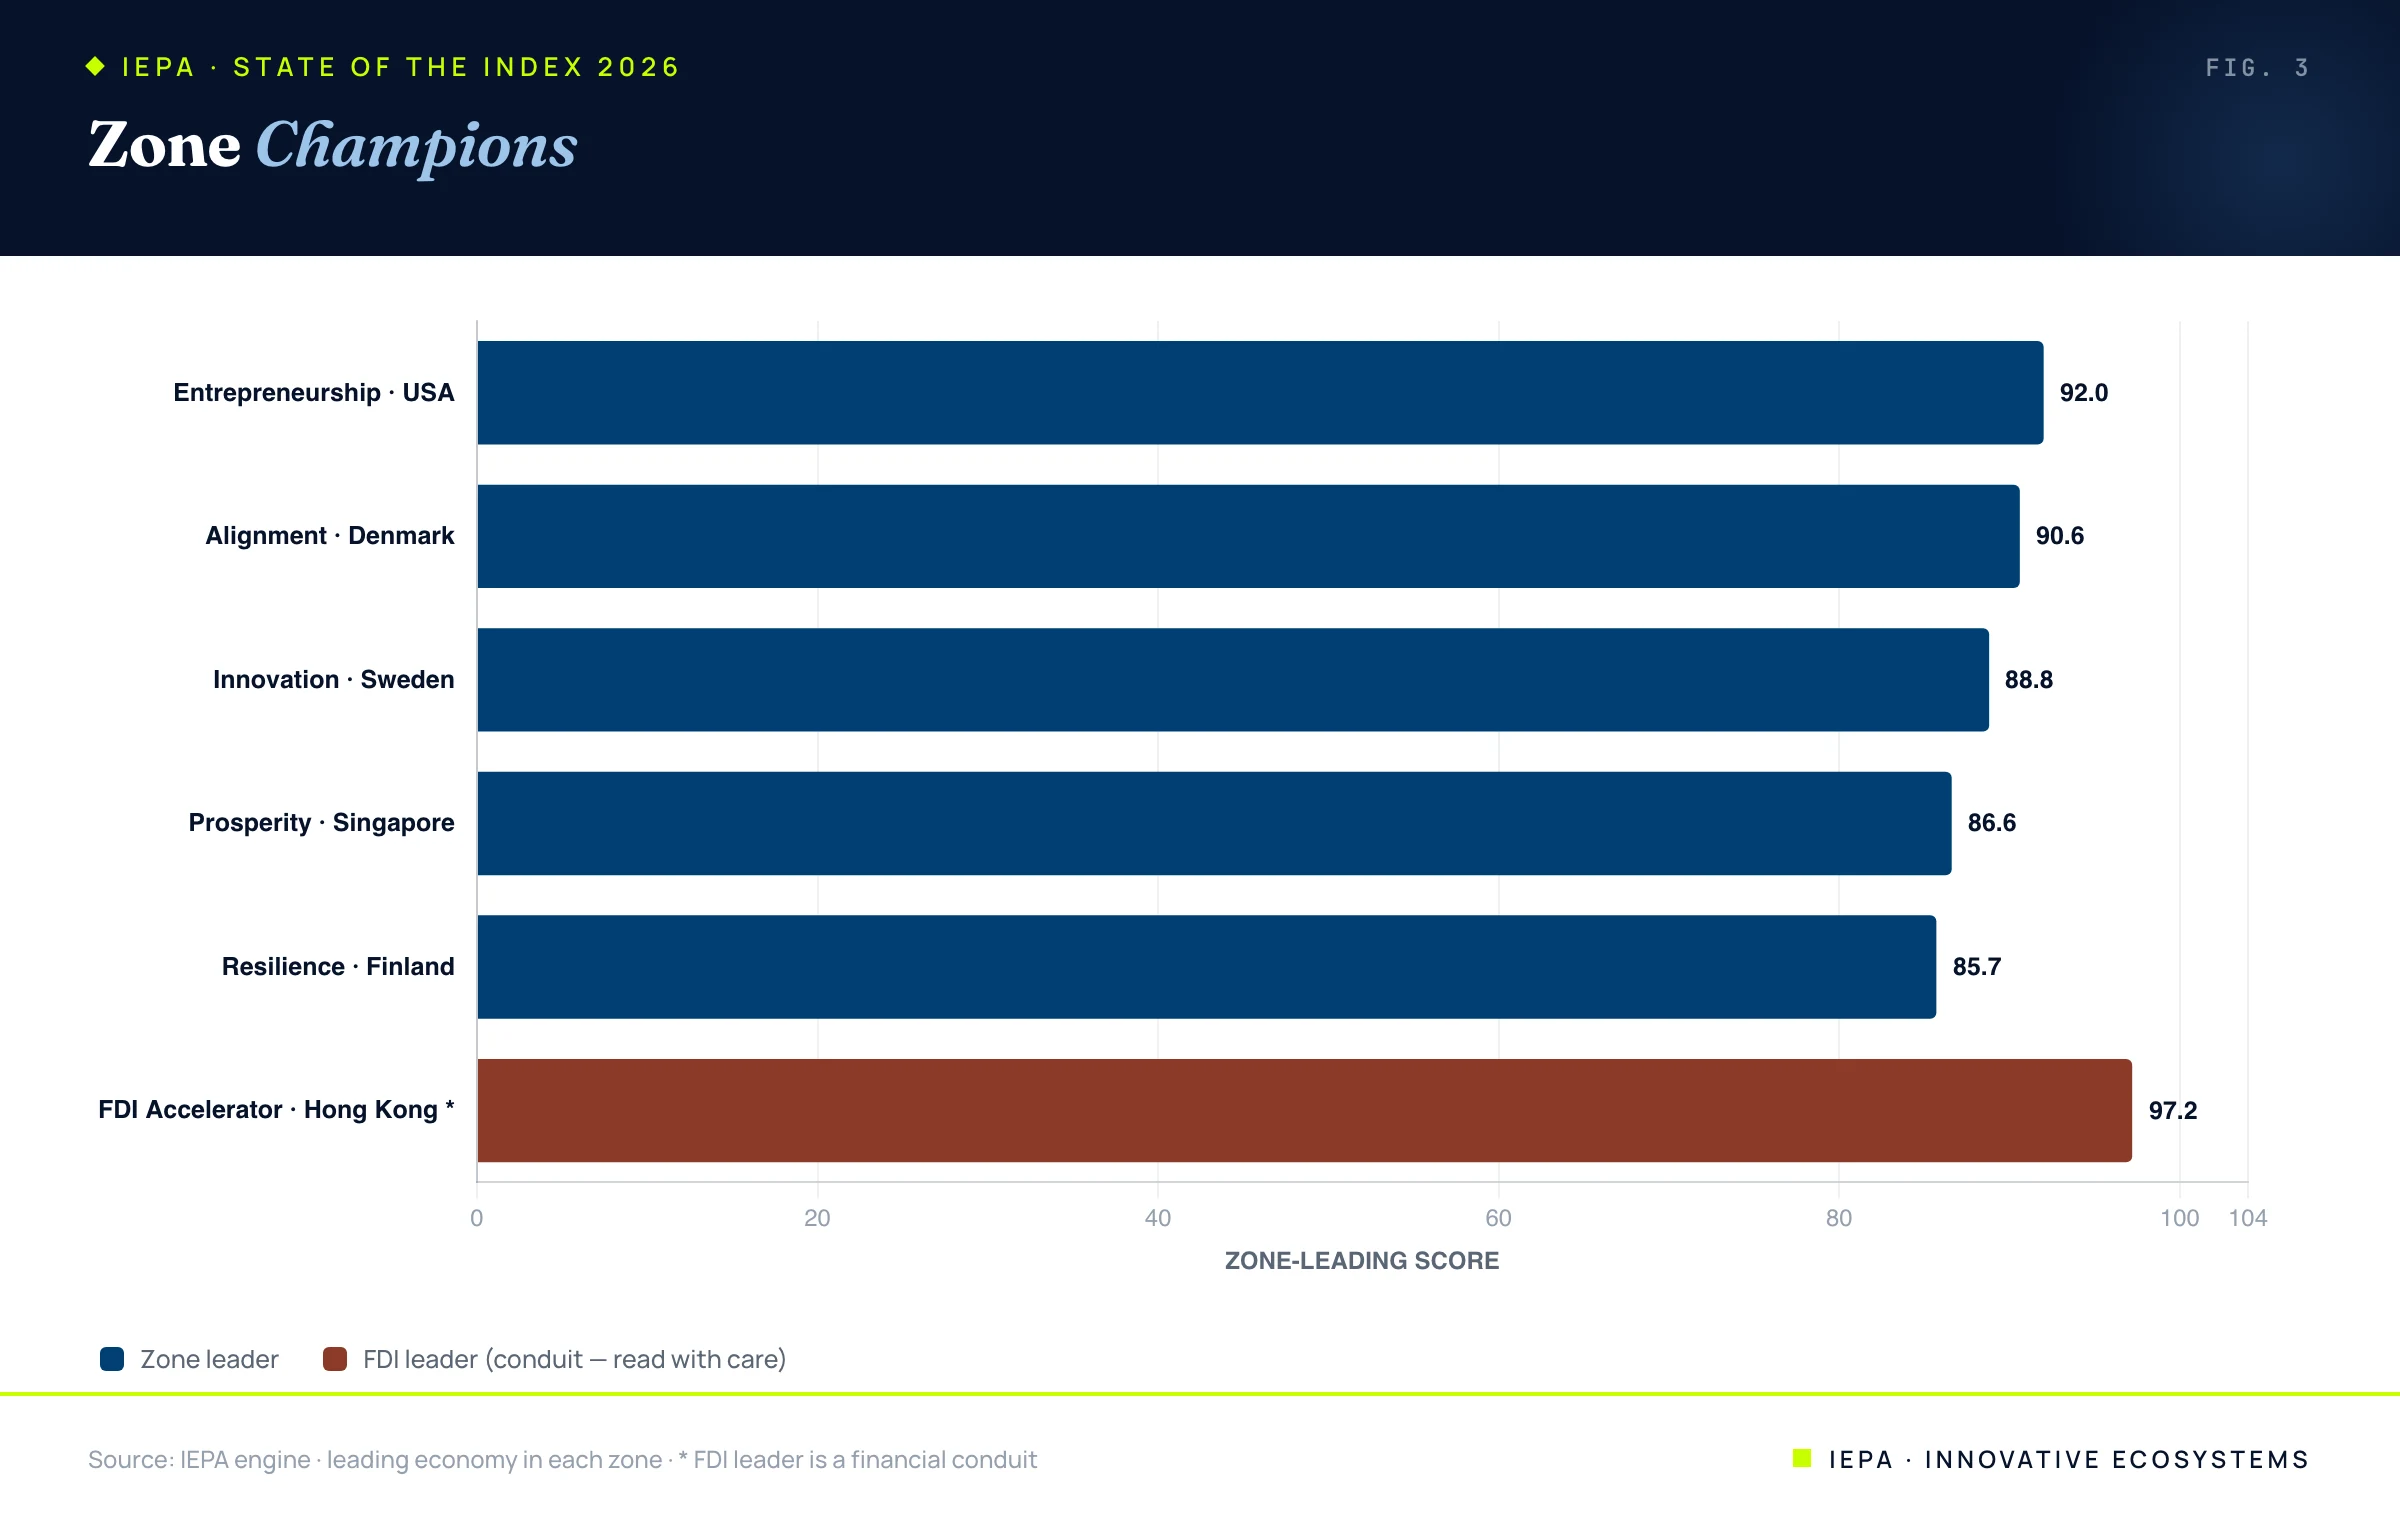
The Nordic bloc is extraordinary on the Foundations zones, taking eight of twelve podium places across Innovation, Resilience, and Alignment. The FDI champion comes with an asterisk: Hong Kong leads at 97.2, but the FDI zone rewards investment intensity, and its top is populated by financial conduits rather than productive-capital magnets. It is the one zone where the headline must be read against the confidence and curation notes.
04The Movers
The IEPA panel carries 15 years of history, which lets it separate the economies that are climbing from the ones that are sliding. The comparison below runs from 2015 to 2024.
The risers
The fastest-improving economies cluster in two arcs: Southern Europe recovering from its lost decade, and the Caucasus and Central Asia opening up.
| Economy | 2015 | 2024 | Change |
|---|---|---|---|
| Mongolia | 45.5 | 61.6 | +16.1 |
| Croatia | 53.4 | 66.6 | +13.2 |
| Armenia | 42.2 | 55.4 | +13.2 |
| Portugal | 57.0 | 68.8 | +11.8 |
| Senegal | 36.2 | 47.8 | +11.6 |
| Greece | 48.1 | 59.3 | +11.2 |
| Serbia | 49.3 | 60.1 | +10.7 |
| Uzbekistan | 33.6 | 43.0 | +9.4 |
The decliners
The steepest falls are a mix of crisis economies and, more notably, several advanced economies whose composites have eroded.
| Economy | 2015 | 2024 | Change |
|---|---|---|---|
| Myanmar | 37.1 | 26.7 | -10.4 |
| Bolivia | 43.9 | 36.1 | -7.8 |
| Malaysia | 66.6 | 59.6 | -7.0 |
| Netherlands | 79.5 | 72.5 | -7.0 |
| Lebanon | 46.8 | 40.2 | -6.5 |
| Switzerland | 80.7 | 74.2 | -6.5 |
| Ireland | 77.0 | 70.7 | -6.2 |
05The Regional Picture
Read by region, the index shows leaders at very different absolute levels, a reminder that the global frontier and the regional frontier are not the same line.
| Region | Leader | Score |
|---|---|---|
| Europe | Denmark | 80.1 |
| Asia | Hong Kong | 77.8 |
| Southeast Asia | Singapore | 76.7 |
| North America | United States | 71.0 |
| Americas | Canada | 69.3 |
| Oceania | Australia | 68.6 |
| Middle East and Africa | United Arab Emirates | 68.4 |
| East Asia | South Korea | 64.2 |
| Africa | Mauritius | 59.6 |
| Latin America | Costa Rica | 52.7 |
| Central Asia | Kazakhstan | 51.7 |
| South Asia | India | 42.9 |
| Sub-Saharan Africa | Ghana | 39.2 |
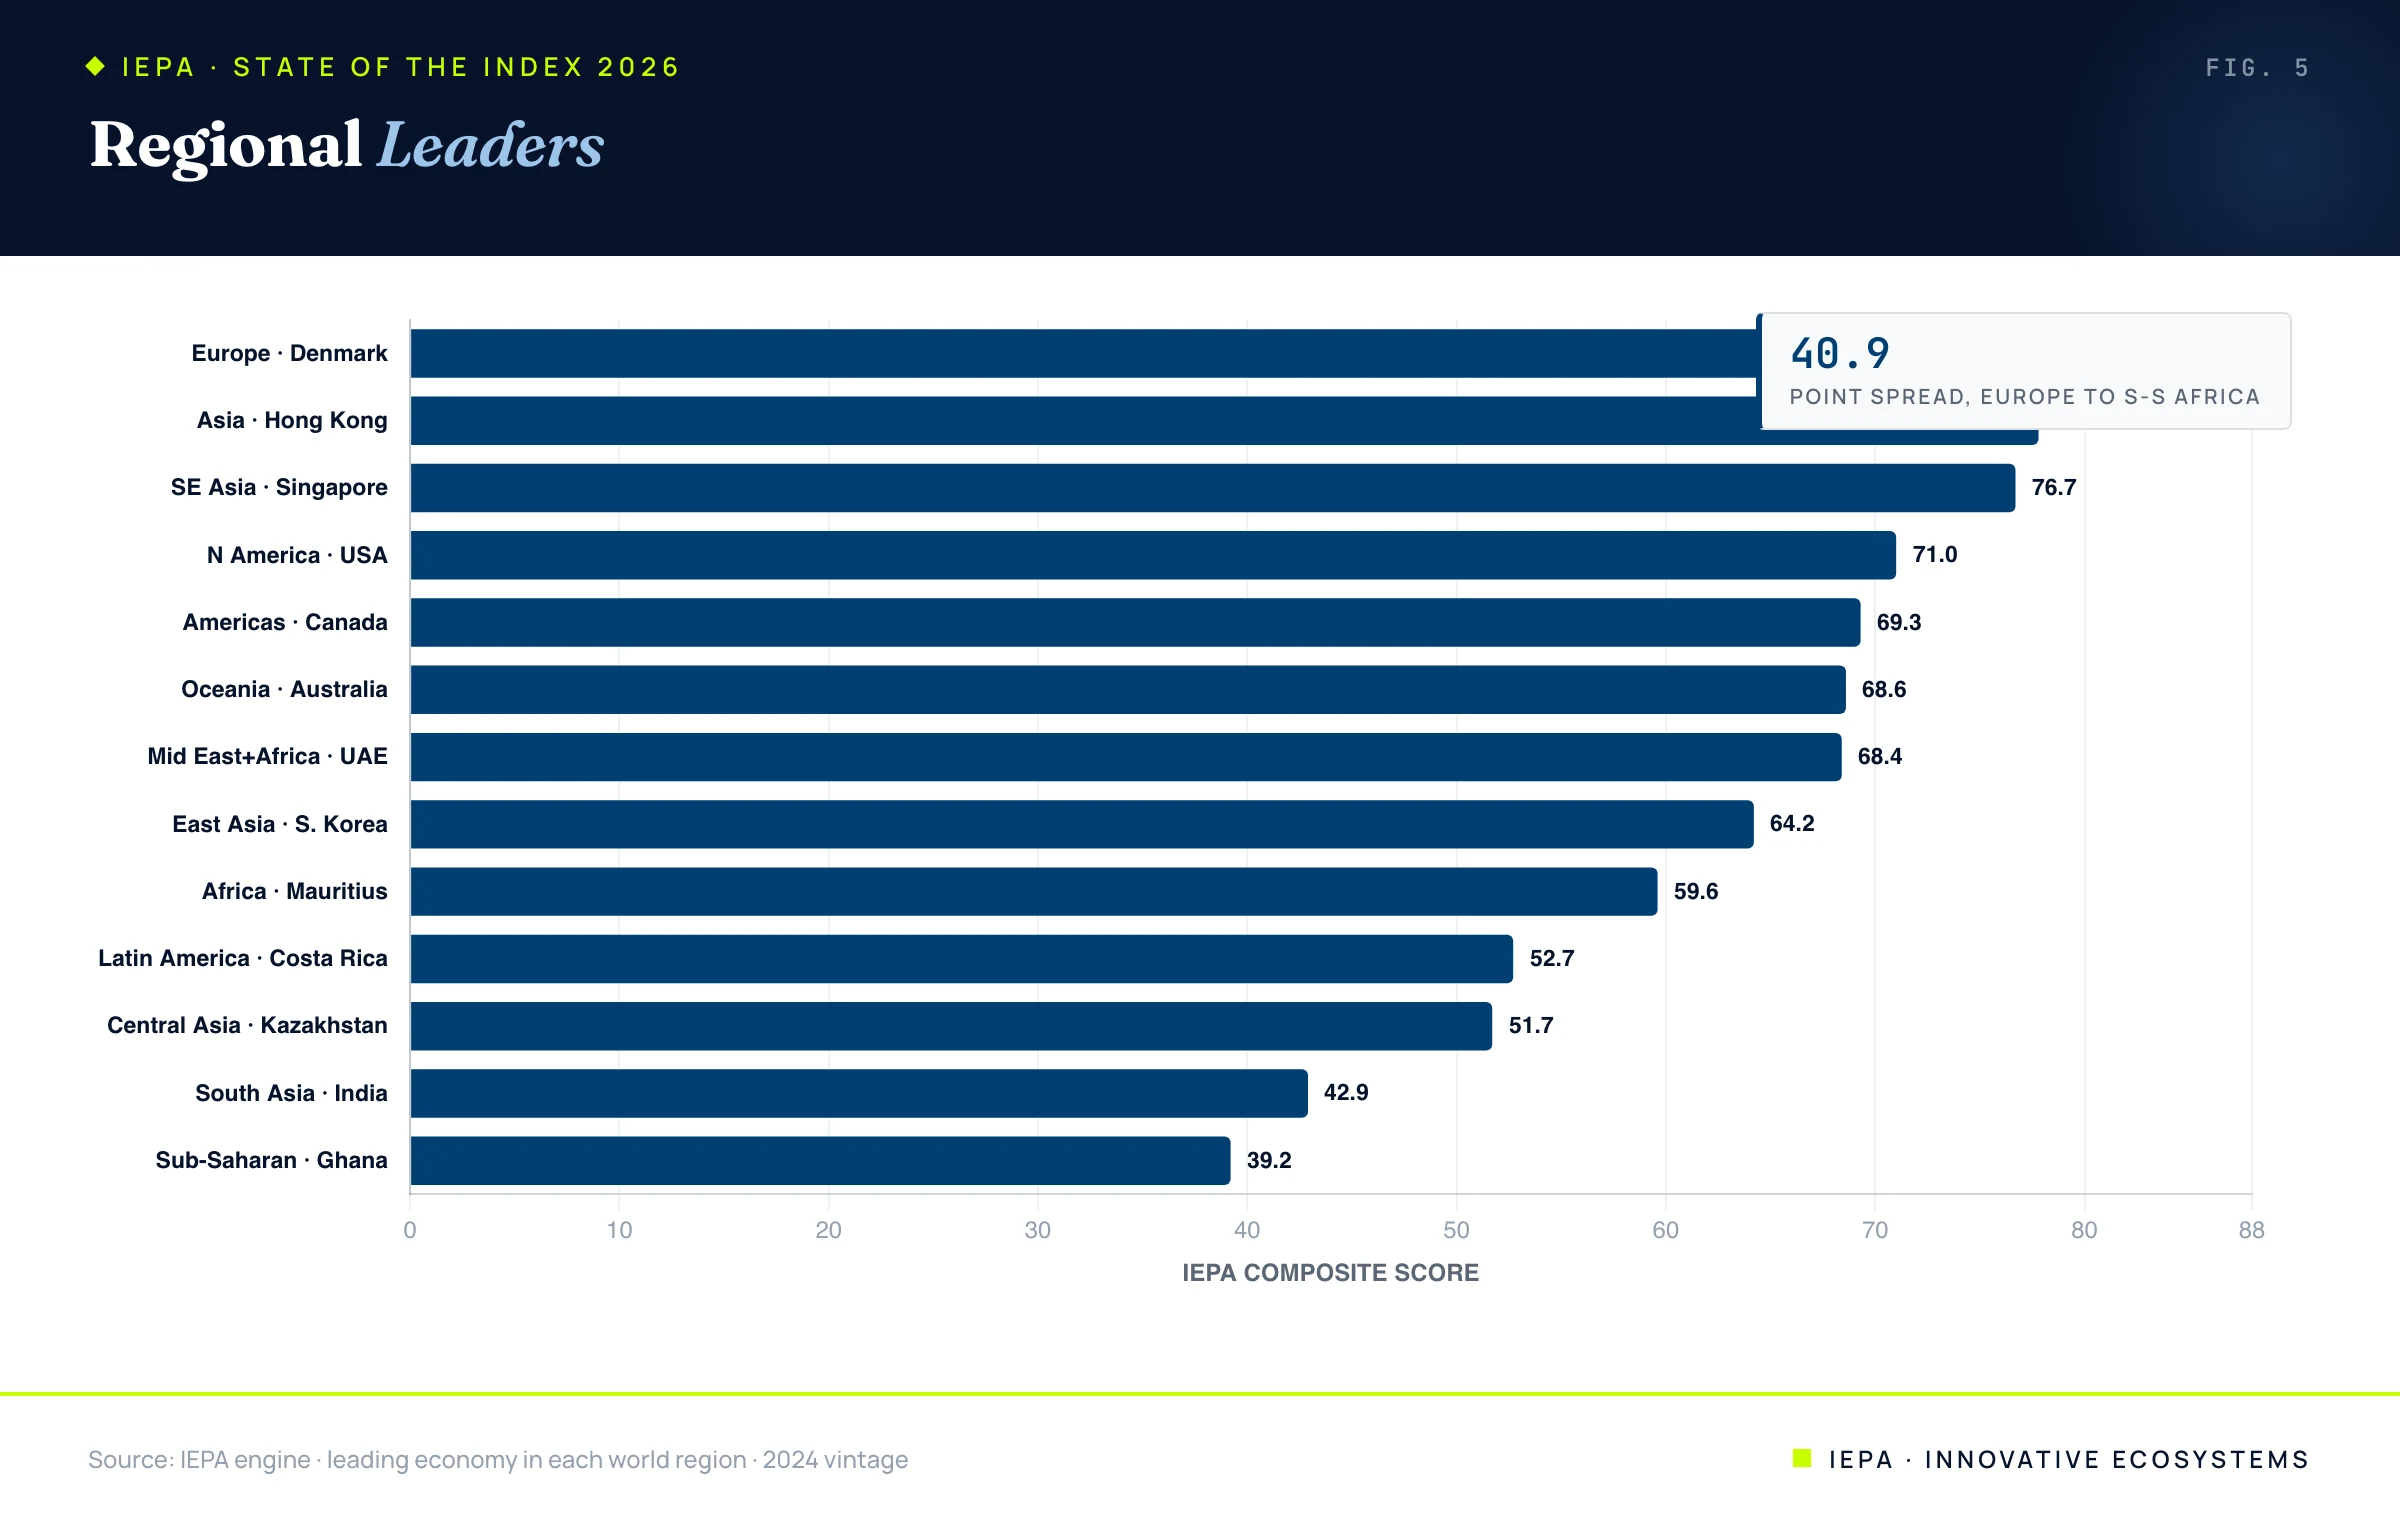
The spread between regional leaders is enormous: from Denmark at 80.1 to Ghana at 39.2, more than 40 points between the best in Europe and the best in Sub-Saharan Africa. Every region has a frontier economy worth studying, and most have a long runway to the global benchmark.
06The Balance Premium
“Balance beats brilliance” is easy to say and rarely tested. The IEPA structure lets us test it directly, because it separates the means of competitiveness, the five input zones, from the realized end, Prosperity Outcomes. If balance matters, then an economy's weakest input zone should predict its prosperity at least as well as its strongest. We computed, across all 117 economies, the correlation between Prosperity Outcomes and four summaries of the five input zones.
The result is unambiguous. The overall level of capability is the best single predictor of prosperity, as expected. But between the two extremes, the weakest zone predicts prosperity better than the strongest (0.59 versus 0.57), and raw imbalance, on its own, is uncorrelated with prosperity. An economy's floor, not its ceiling, is the better guide to the outcome it actually achieves.
This is the macro-scale echo of a known microeconomic structure. The O-Ring theory of economic development models production as a chain of complementary tasks in which output is governed by the weakest link: like the single failed O-ring that destroyed the Challenger, one broken task compromises the whole. An economy brilliant on innovation but broken on alignment or resilience does not convert the brilliance into prosperity, because the weak zone binds the chain. This is why Singapore, excellent everywhere and supreme nowhere, converts its balance into the highest Prosperity Outcomes in the world, while lopsided economies with a spectacular single peak underperform their headlines.
A region is only as competitive as its weakest zone. Prosperity is built by the floor, not the ceiling.
07Convergence, and the Advanced-Economy Stall
The report's second structural claim is that momentum lives in the middle and the margins. The classic tool for testing it is a beta-convergence regression, which asks whether economies that started lower subsequently grew faster. Regressing each economy's 2015-to-2024 change in IEPA on its 2015 starting level gives a slope of −0.060 (r = −0.18): a negative coefficient, the signature of convergence. Each additional point of starting score is associated with roughly 0.06 less decade gain. The gap is closing, slowly.
The quartile cut sharpens the picture, and adds a second story the average hides.
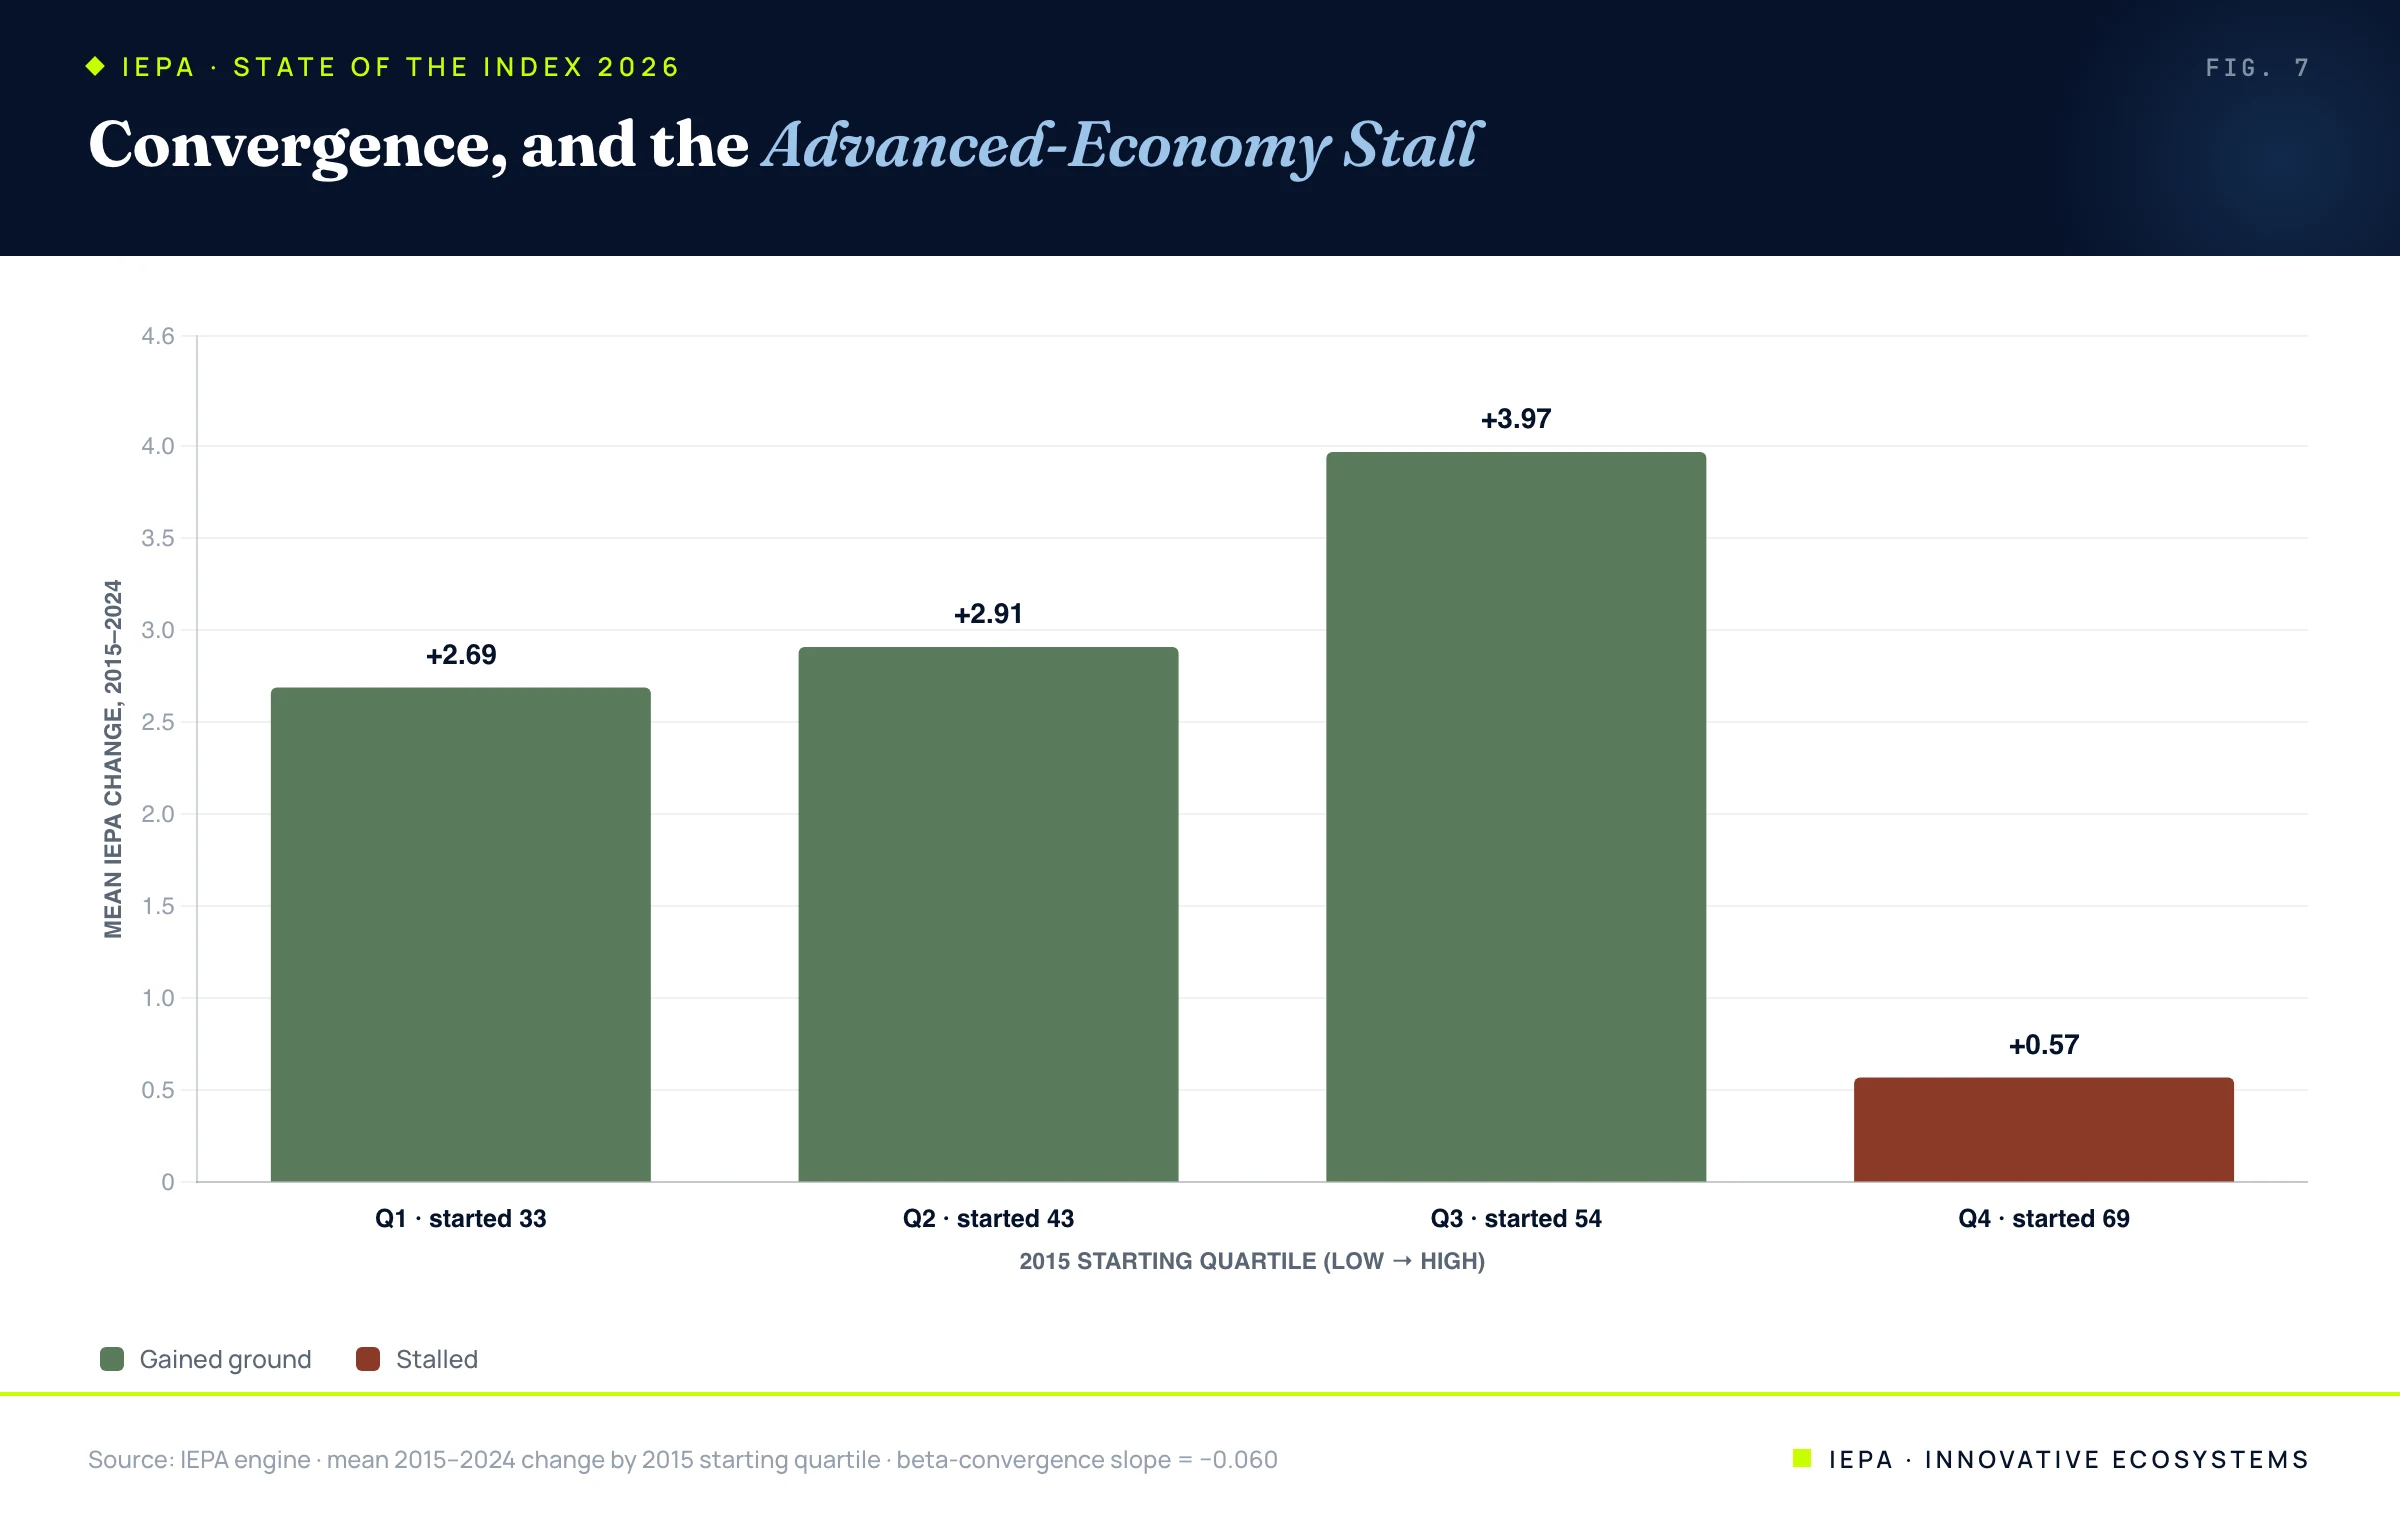
The catch-up is genuine but concentrated in the upper-middle: the third quartile, economies that started near 54, gained the most over the decade (+4.0), while the bottom two quartiles gained a respectable +2.7 to +2.9. The advanced quartile, starting near 69, effectively stalled, adding just +0.6. The stall is consistent with the growth-slowdown and middle-income-trap literature, which finds that fast growth decelerates as economies approach the frontier. Our data adds the uncomfortable corollary that the frontier itself is not a safe harbor: the Netherlands, Switzerland, and Ireland each shed more than six points over the decade. Convergence is real but weak; the frontier is reachable, and losable.
08What the 2026 Index Says
Balance beats brilliance, and now it is measured. Prosperity tracks the weakest zone more than the strongest. Singapore leads the curated board without owning a single input zone because completeness, not any single peak, is what converts into realized prosperity. The economies that win are the most complete, not the most spectacular.
The momentum is in the middle and the margins, confirmed by the convergence test. The fastest climbers are catch-up economies, concentrated in the upper-middle of the distribution. Mongolia, the single largest riser in the field, gained sixteen points over the decade as it opened to trade and foreign capital, the kind of trajectory a region can compound with deliberate structure rather than wait to repeat by luck. They map directly onto where regional capital and structure can compound a recovery already underway. This is the IE thesis in the trend data.
Advanced economies are not safe. The top quartile stalled, and three frontier economies fell sharply. Competitiveness decays without maintenance, and a high score is a snapshot, not a guarantee.
The headline number is never enough. The raw top of the table, led by Denmark and Hong Kong, is not the board we can fully defend, led by Singapore and the United States. Confidence and curation are the difference between a number you can act on and a number that will mislead you.
09How to Read This Index
Every figure in this report carries a confidence value, and the curated surfaces show only economies scored on enough deep data to stand behind; the full 117-economy field remains available behind explicit tier and confidence filters. Where raw foreign-investment ratios are distorted by financial conduits, IEPA labels the distortion rather than editing the underlying numbers, mirroring the practice now used by UNCTAD and documented by the IMF. The balance and convergence analyses above are cross-sectional and correlational; they identify structure, not proven causation, and the complete methodology, weighting, normalization, confidence, and tiers, is published separately. The data behind this report is live and reproducible from the IEPA engine.
All economy-level scores, the Balance Premium correlations, the convergence regression, the movers, and the field statistics are computed from the proprietary IEPA engine maintained by Innovative EcoSystems. Academic and external sources are listed below.
- Kremer, M. (1993). The O-Ring Theory of Economic Development. Quarterly Journal of Economics, 108(3), 551–575.
- Barro, R. J., & Sala-i-Martin, X. (1992). Convergence. Journal of Political Economy, 100(2), 223–251.
- Eichengreen, B., Park, D., & Shin, K. (2012). When Fast-Growing Economies Slow Down: International Evidence and Implications for China (Middle-Income Trap). NBER Working Paper 18673.
- Innovative EcoSystems. The IEPA Index, Methodology, and The FDI Paradox (companion papers).
- WIPO (2024). Global Innovation Index 2024.
- UNCTAD (2024). World Investment Report 2024.
- Damgaard, J., Elkjaer, T., & Johannesen, N. (2019). The Rise of Phantom Investments. IMF Finance & Development.
- UNDP. Human Development Index data.
The Outcome You Cannot Build
Prosperity is a readout, not a lever. Why three tied scores tell three different stories.
→Explore the IEPA
Six zones, every market this research is scored from.
→Open the Atlas
The live global registry this research is drawn from.
→