The Outcome You Cannot Build
Prosperity is the only zone an economy does not build directly. It is the readout of the other five, and the gap between what a place has built and what it has realized is the most diagnostic number in the index.
The sixth and final IEPA zone, Prosperity Outcomes, measures what an economy has actually realized for the people in it: income, growth, employment, the escape from poverty. Every other zone is an input, a thing a region builds. This is the one zone it cannot build directly. Prosperity is produced, by the five capabilities underneath it, and the way it is produced is the whole reason the index has six zones instead of one number.
- Prosperity is the readout, and the foundations explain about half of it. An economy's four foundation zones predict its realized prosperity with an R-squared of 0.48. Half the story is the capability underneath. The other half is the gap.
- The gap is the most diagnostic number in the index. Some economies live above their foundations, realizing more prosperity than they have built, on resource rents or fast catch-up growth. Others live below, with capability already in place that has not yet converted. The sign of the gap is a forward-looking signal the headline number hides.
- Three economies, one prosperity score, three different stories. South Korea, Malaysia, and Kazakhstan all post a Prosperity of 74. Their foundations are 67, 55, and 50. One built it, one is building it, one is drawing it from the ground. A single number cannot tell them apart. The six-zone profile can.
- This is why the index has six lenses. Prosperity is the verdict every ranking reports. The five zones beneath it are the reason the verdict reads the way it does, and the only way to know whether a prosperous economy is compounding or coasting.
For five essays we have taken the index apart one zone at a time: the capacity to invent, the capacity to commercialize, the institutional floor, the resilience to hold under shock, and the foreign capital that accelerates whatever is already there. This last zone is the one all the others were quietly pointing at. Prosperity is not another capability an economy accumulates. It is the result the five capabilities produce, the score on the board at the end of the work. And because it is a result rather than an input, the most useful thing about it is not its level but its distance from everything underneath it.
01What the Zone Measures
Prosperity Outcomes scores the realized end of development: real income per person, growth, the breadth of employment, the retreat of poverty. It is the only zone in the index made of outcomes rather than capacities, and it carries the largest single-zone weight in the composite at 0.30, because it is the thing the other five exist to produce. Where the foundations ask what an economy can do, this zone asks what it has actually delivered to the people living in it.
That distinction is the oldest one in development thinking. Amartya Sen built his entire framework on the difference between an economy's capabilities, the real freedoms and capacities it has assembled, and its functionings, what those capabilities are actually converted into in people's lives. Prosperity is the IEPA's measure of the second thing, the realized functioning. Sen's insight was that the two do not move together automatically: a place can hold capabilities it fails to convert, and a place can post outcomes its capabilities did not earn. The space between the two is not measurement error. It is the most informative quantity in development, and the index is built to measure it.
02Prosperity Is the Readout
Begin with how much of prosperity the rest of the index explains. Take the four foundation zones, weight them as the engine does, and ask how well that single capability score predicts the prosperity an economy actually realizes.
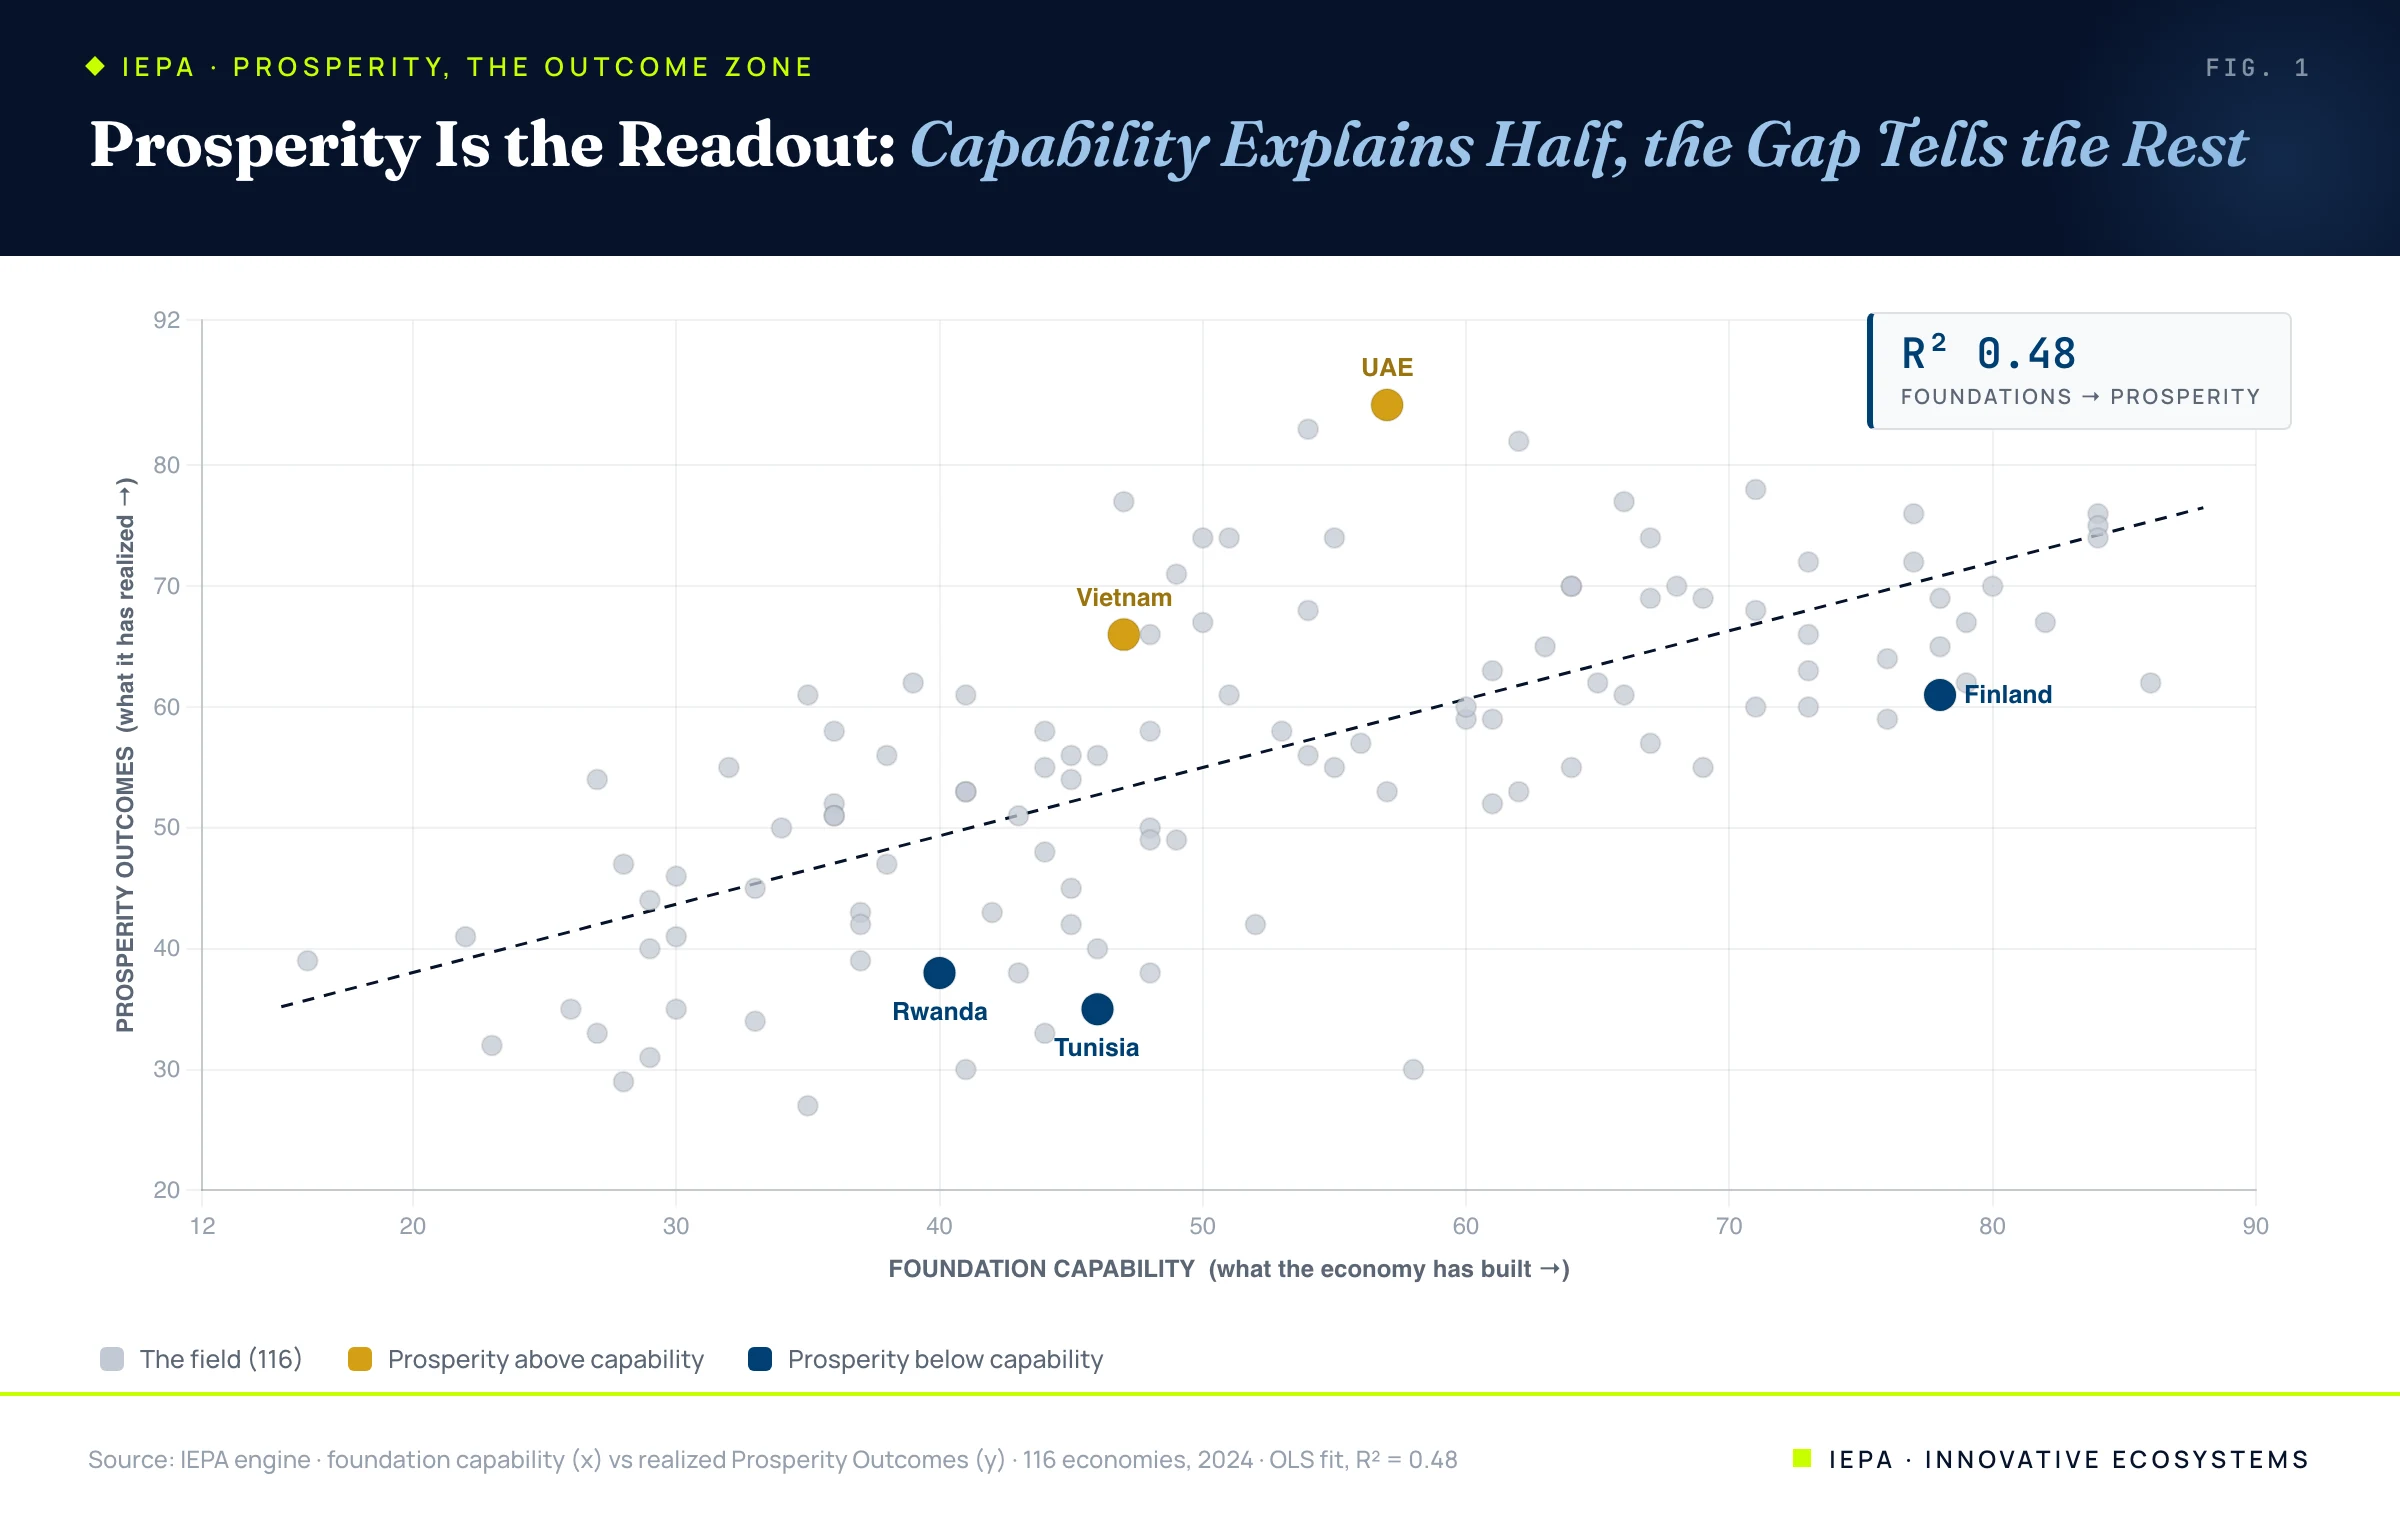
An R-squared of 0.48 is the right amount of explanation for an honest index. It is high enough to confirm that the foundations are real, that capability genuinely produces prosperity and the index is measuring something true. It is low enough to leave half the outcome unexplained by capability, which is exactly as it should be, because the rest is driven by things capability cannot account for: resource endowments, demographic timing, the slow lag between building a foundation and realizing its return. Notably, the foreign capital that regions chase hardest is not what closes the gap; the FDI Accelerator correlates with prosperity at just 0.31. The foundations explain the predictable half of prosperity. The unexplained half is where the index earns its keep.
03The Gap Is the Diagnostic
That unexplained half is not random noise scattered evenly around the line. It is structured, and its structure is readable. Sort the economies by how far their realized prosperity sits above or below what their foundations predict, and two distinct populations appear.
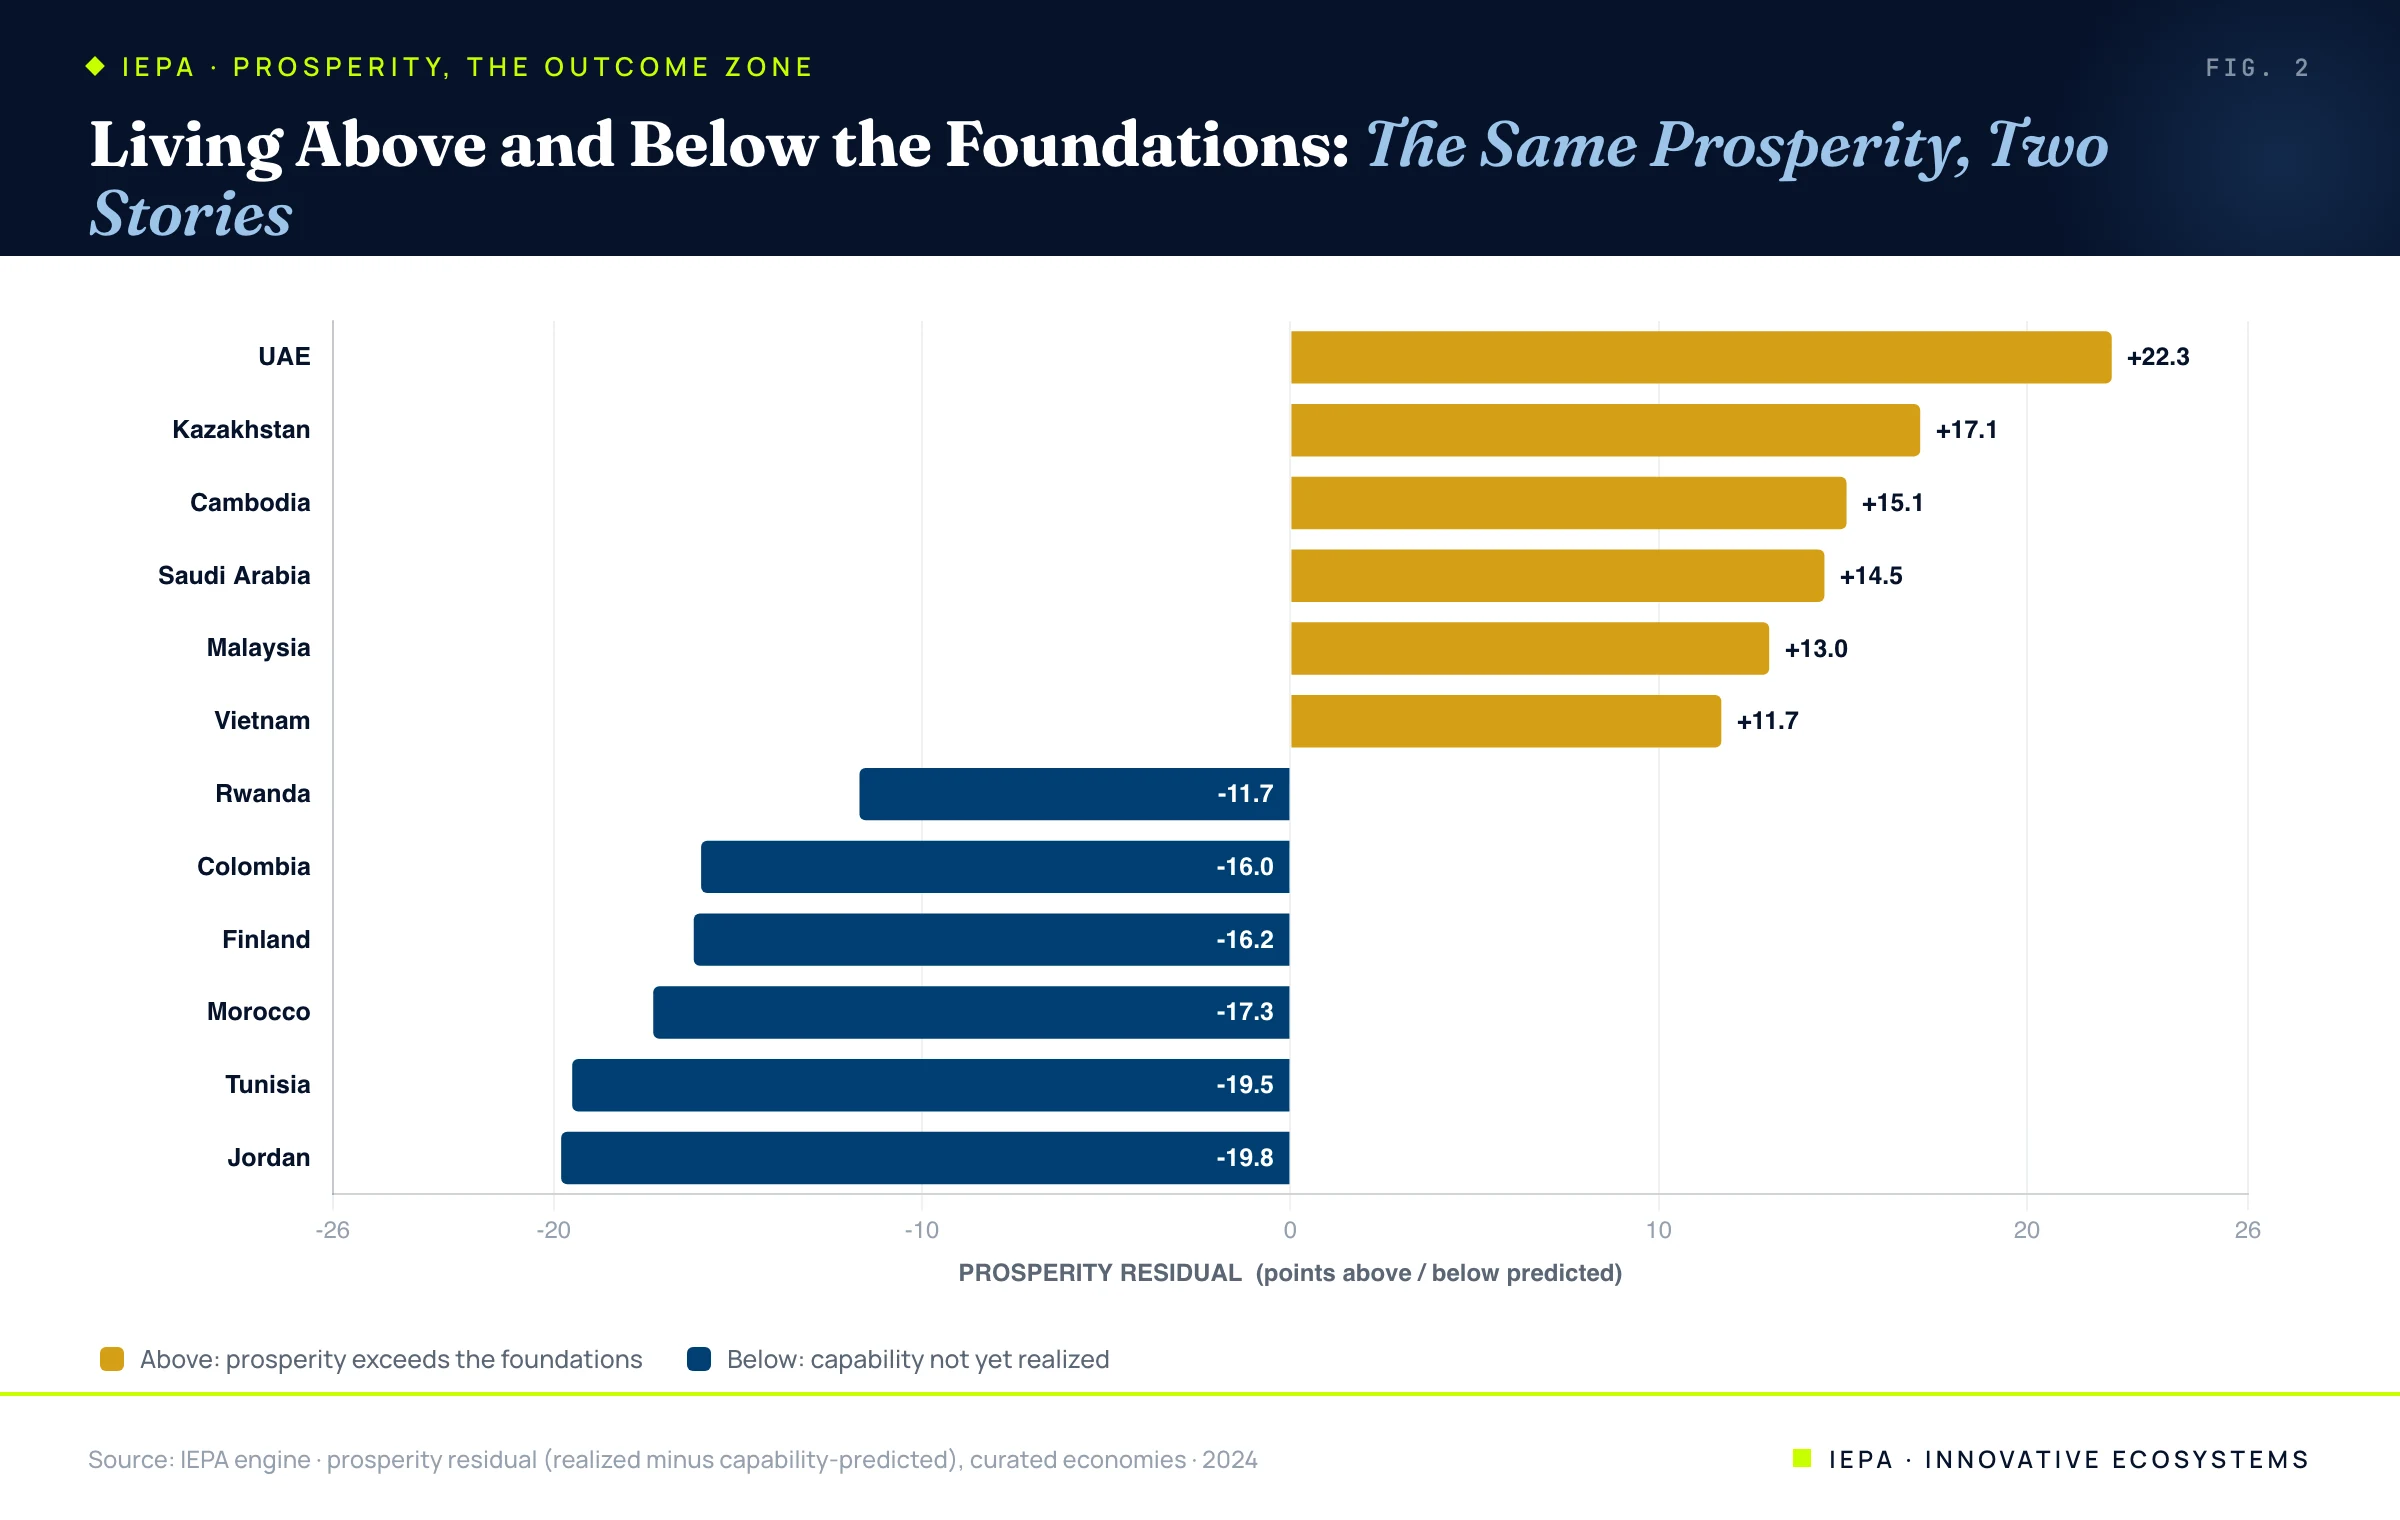
The two signs mean opposite things, and neither is visible in a prosperity ranking. A positive gap, prosperity above the foundations, flags an economy living on something other than what it has built: the Gulf states and Kazakhstan on resource rents, Vietnam and Cambodia on catch-up growth their institutions have not yet locked in. We documented the resource-rent half of this pattern in our prosperity capstone, where petrostates systematically over-performed their fundamentals. A negative gap, capability above prosperity, flags the reverse: Rwanda building a foundation whose return is still arriving, Tunisia and Jordan holding real institutional capability that regional conditions have stranded, and Finland, whose foundations are so far ahead of its measured outcomes that the gap is mostly an artifact of how growth is scored. The gap does not deliver a verdict on its own. It raises the question, and points to the five other zones for the answer.
| Economy (2024) | Prosperity | Capability | Composite |
|---|---|---|---|
| Singapore | 87 | 76 | 77 |
| UAE | 85 | 57 | 68 |
| South Korea | 74 | 67 | 64 |
| Malaysia | 74 | 55 | 60 |
| Kazakhstan | 74 | 50 | 52 |
| United States | 72 | 77 | 71 |
| Saudi Arabia | 71 | 49 | 52 |
| Israel | 69 | 69 | 62 |
The middle of the table is the whole argument. South Korea, Malaysia, and Kazakhstan are tied on prosperity at 74, indistinguishable on the number that headlines every ranking. Underneath, they are three different economies: Korea has built a capability of 67 and largely earned its prosperity; Malaysia at 55 is still building toward its; Kazakhstan at 50 is drawing its prosperity from the ground rather than from what it has assembled. Read the composite column and the index has already sorted them, 64 to 60 to 52, because the IEPA does not reward prosperity that the foundations did not produce. The UAE makes the same point at the top: second in realized prosperity, but a capability below the curated average, and a composite that places it accordingly. The United States makes the opposite one: a prosperity of 72 sitting on a capability of 77, an economy that has realized almost exactly what it built.
04Why One Number Is Not Enough
This is where the six lenses close into a single argument. A prosperity ranking, the one-number league table that most indices resolve to, would seat Kazakhstan beside South Korea and call them equals. It would read the UAE as more successful than Germany. It would tell a region chasing development that the goal is the score on the board, without ever revealing whether that score rests on a foundation that will hold or a windfall that will not. The number is real, but on its own it is silent about the only thing a builder needs to know: is this prosperity compounding, or is it coasting?
The decomposition is what makes the number speak. Walk back through the zones and each one is a different question the single figure cannot answer. Can the economy invent, and does it commercialize what it invents? Do its institutions cohere, and will they hold under shock? Does the capital it attracts find a foundation to multiply? Prosperity is the sum, but the six-zone profile is the explanation, and only the explanation tells a government, an investor, or an operator whether the prosperity in front of them is an asset to build on or a balance to be spent down. That is the entire reason we built six zones instead of one, and the prosperity zone is where the choice pays off, because it is the one number everyone already watches and the one most likely to mislead them alone.
A prosperity score tells you where an economy stands. Only the six zones beneath it tell you whether it can stay there.
05The Builder's Reading
For a region, the lesson of the final lens is to stop optimizing the scoreboard and start building the thing that produces it. Prosperity cannot be targeted directly; every attempt to do so is really an attempt to move one of the five zones underneath it, and the regions that confuse the readout for the lever end up chasing the windfall instead of the foundation. The durable path runs the other way. Build the capacity to invent and to commercialize, lay the institutional floor and the resilience to hold it, and let foreign capital compound what is already there, and prosperity arrives as the return on all of it, earned rather than borrowed, with the foundation to keep it.
That is the close of the Six Lenses, and the case for the instrument itself. The IEPA exists because prosperity is too important to read as a single number and too easily faked to trust as one. Behind every headline figure is a profile, and the profile is the truth: which capabilities are real, which are missing, whether the success on the board was built or merely banked. An economy is not the score it posts. It is the six things underneath that score, and whether they are sound enough to post it again next decade. The index is built to see all six, because that is the only honest way to answer the question every region is really asking, which is not how prosperous are we today, but will we still be prosperous when today's advantages are gone.
Capability is the engine-weighted mean of the four foundation zones; the prosperity regression, residuals, and zone scores are computed on the live IEPA engine across 117 economies for the 2024 assessment year, the headline reference vintage, with later years treated as trend extension. Scores are normalized 0 to 100. No estimates.
- Sen, A. (1999). Development as Freedom. Oxford University Press.
- Innovative EcoSystems. What 117 Economies Taught Us About Prosperity. 2026.
- Innovative EcoSystems. The Accelerator, Not the Engine, and Coherence Comes First. 2026.
- Innovative EcoSystems. Why We Built Six Zones Instead of One Number. 2026.
- Innovative EcoSystems. The IEPA Index and Methodology. 2026.