Why We Built Six Zones Instead of One Number
Korea just rose to 21st on a global ranking. That sentence, celebrated everywhere, is exactly the problem we built the index to fix.
The IEPA index refuses to collapse an economy into one figure. It reports six: five capability zones (Innovation Capacity, Entrepreneurship Capacity, Alignment, Resilience, and the FDI Accelerator) plus Prosperity Outcomes. People ask us for the single headline number anyway. This is the case, made on our own data, for why we will not give them one.
- A single score is an average that fits almost no one. Across 117 economies the typical country differs from itself by 32.5 points across its six zones, on a 0 to 100 scale. The composite smooths away a third of the scale.
- The zones do not move together. Innovation Capacity predicts the FDI Accelerator at a correlation of just 0.23. You cannot infer how open an economy is from how inventive it is. Each lens carries information the others do not.
- Identical scores, opposite economies. New Zealand, Korea, and Bahrain sit within half a point of each other on the composite. One is an institutions powerhouse that cannot pull capital, one an innovation story with a soft middle, one a capital magnet with almost no innovation base. The number calls them the same. They are not.
- A rank tells a country where it stands. A profile tells it what to build. Only the second is a plan, and building from it is what Innovative EcoSystems exists to do.
In June 2026, Korea rose to twenty-first in the IMD World Competitiveness Ranking, and the coverage wrote itself. Up the table. A national win. It is a genuine achievement, and it is also the cleanest possible illustration of the trap a single number sets. Twenty-first of what? A rank answers where a country sits in a line. It cannot answer the only question a builder actually has, which is what the country is made of, and therefore what to do on Monday.
01The Number That Hides the Country
One number is seductive for the same reason it is dangerous. It is portable, it is rankable, and it ends the conversation. It also discards the thing a policymaker, an investor, or an ecosystem builder needs most, which is the shape underneath.
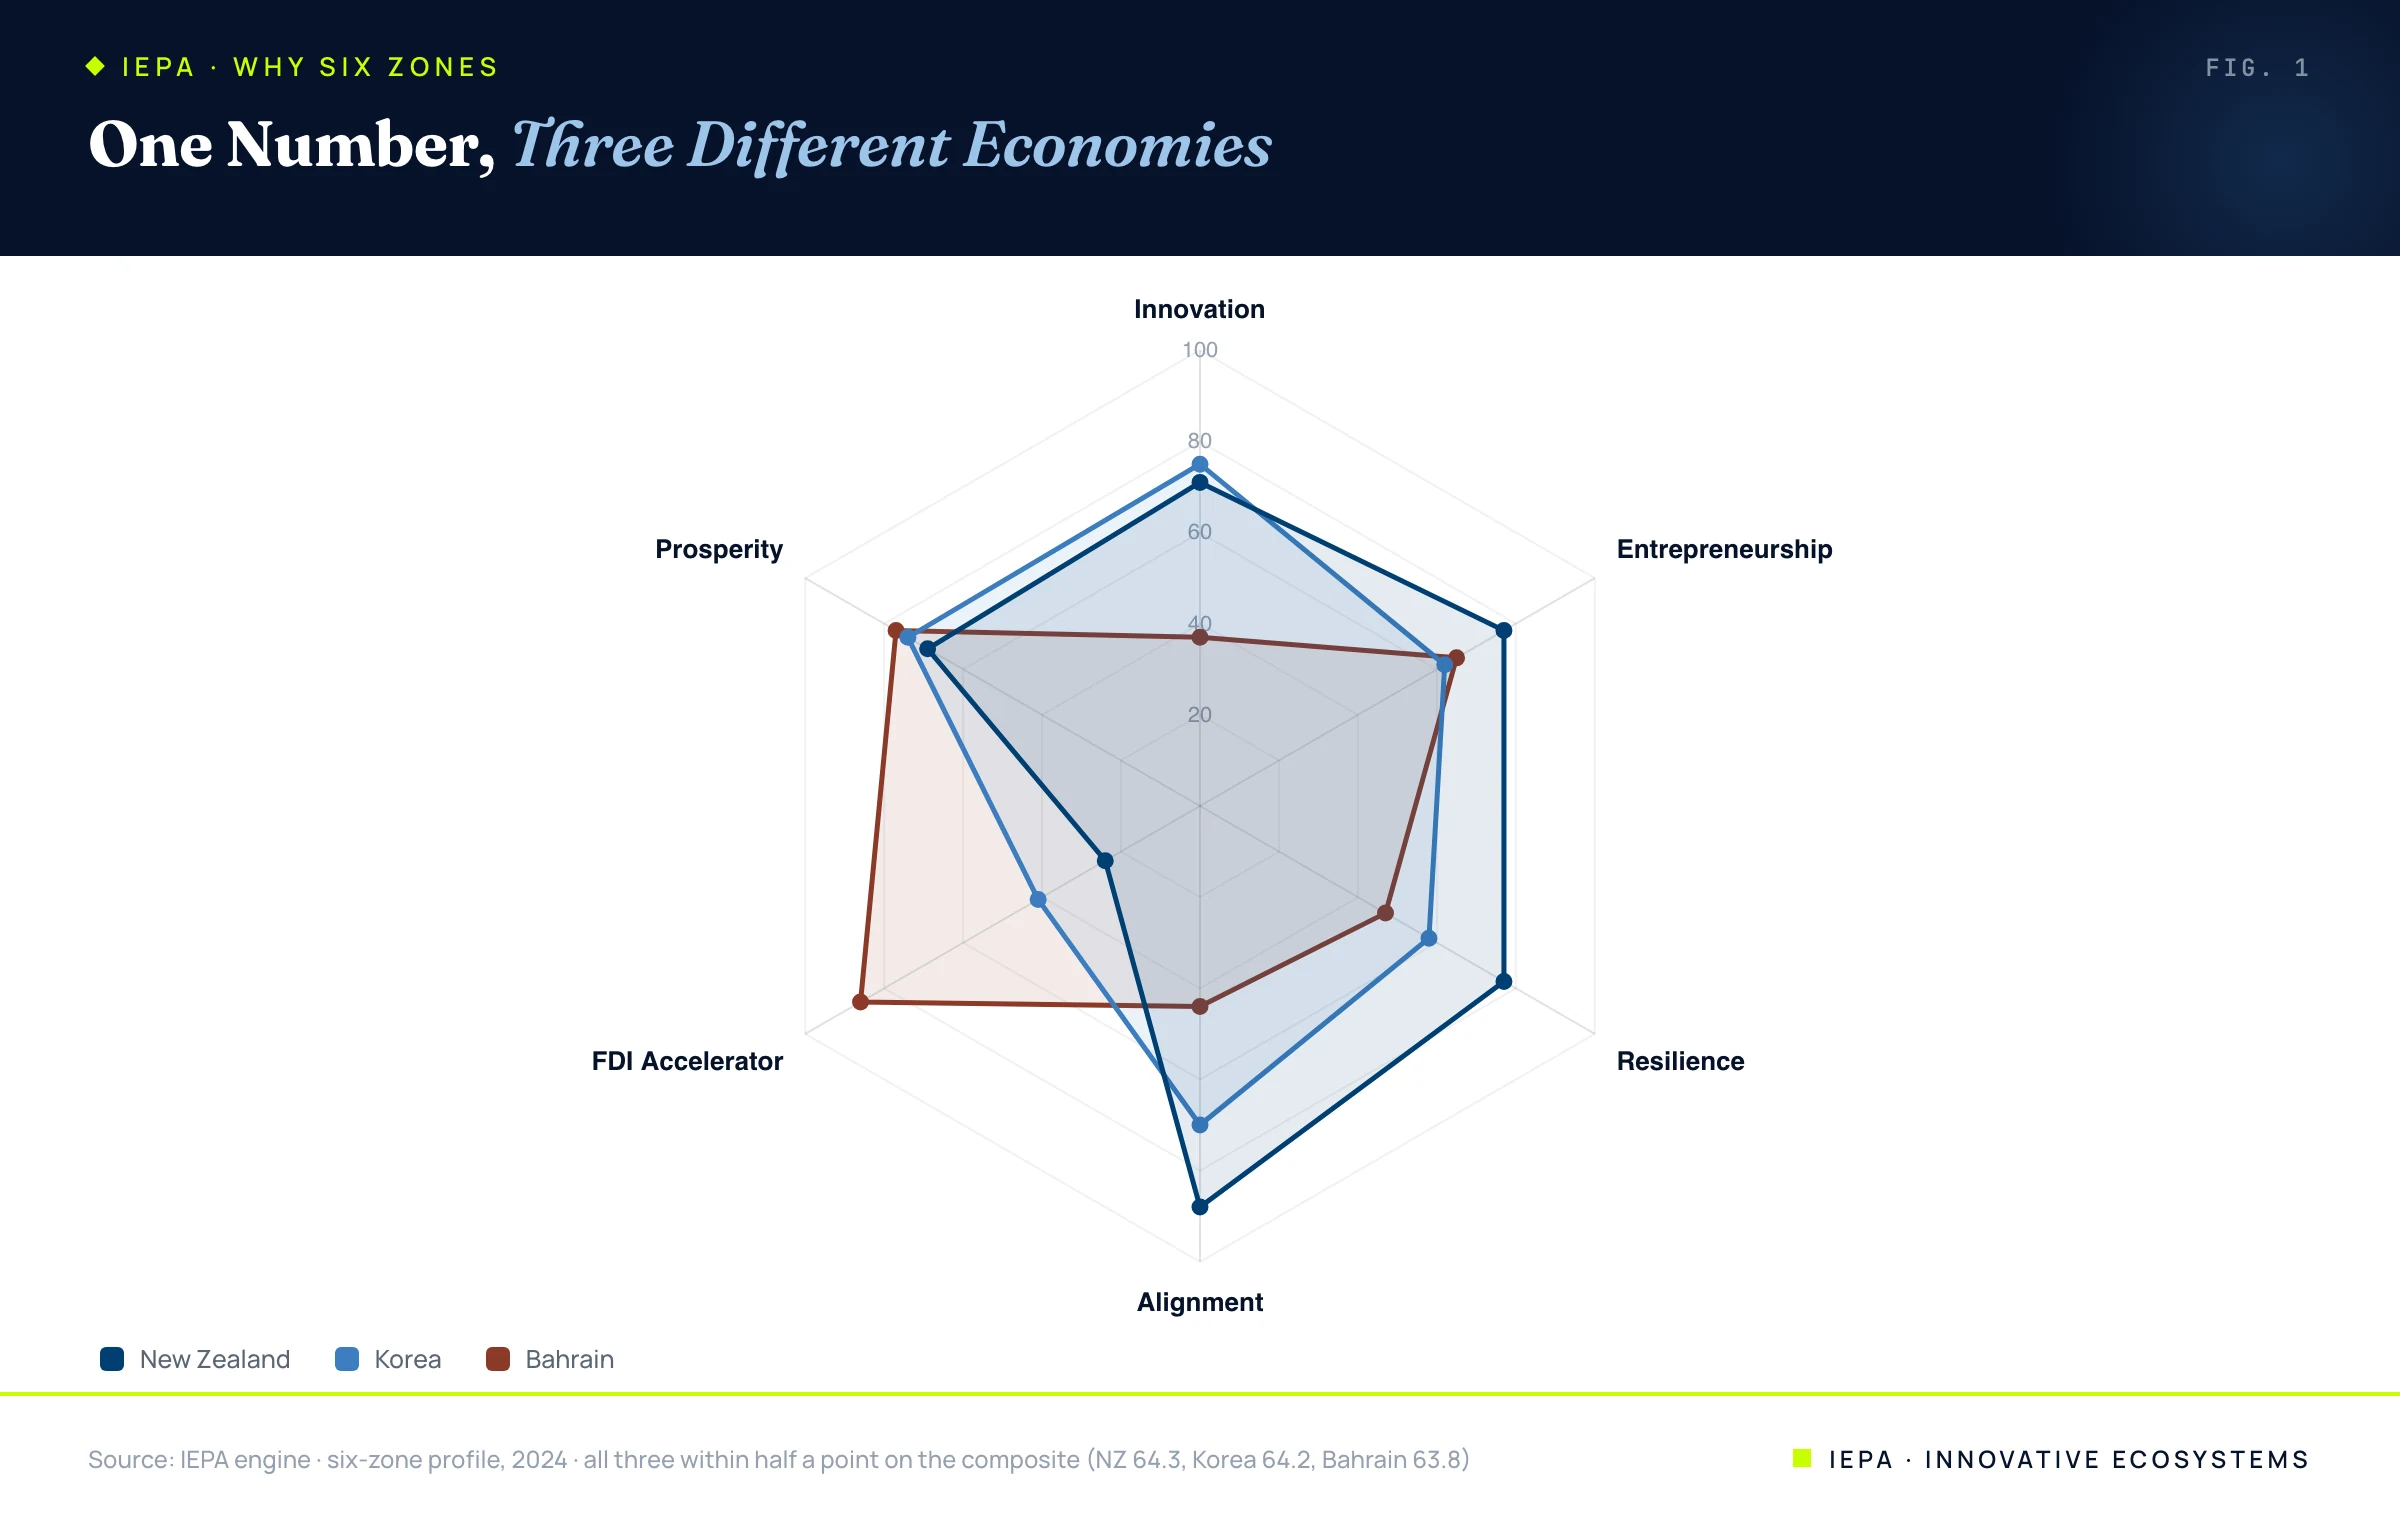
Take Korea at the moment of its IMD win. In the IEPA index its composite is 64.2. So is New Zealand's, at 64.3. So is Bahrain's, at 63.8. Three economies, separated by half a point, that any single-number ranking would file in the same drawer. Now look at what the six lenses see.
| Zone (2024) | New Zealand | Korea | Bahrain |
|---|---|---|---|
| Composite | 64.3 | 64.2 | 63.8 |
| Innovation Capacity | 71 | 75 | 37 |
| Entrepreneurship | 77 | 62 | 65 |
| Alignment | 88 | 70 | 44 |
| Resilience | 77 | 58 | 47 |
| FDI Accelerator | 24 | 41 | 86 |
| Prosperity Outcomes | 69 | 74 | 77 |
The single number is a coincidence. The economies are not even in the same business. New Zealand is an institutions and alignment powerhouse (88 on Alignment, 77 on Resilience) that is nearly closed to foreign capital (24). Bahrain is its mirror image, a capital magnet (86 on the FDI Accelerator) sitting on almost no innovation base (37). Korea is a third thing entirely, an innovation and prosperity story (75 and 74) with a resilience soft spot. One number told you they were equals. The profile tells you they have three different strengths and, more usefully, three different problems to fix.
02The Lenses Do Not Substitute for Each Other
You could forgive the single number if the six zones simply rose and fell together. If a country good at one thing were reliably good at the rest, a composite would lose little, because any one figure would stand in for all of them. The data says the opposite. The zones are loosely coupled, and one of them, openness to capital, is nearly independent of the rest.
This is the empirical heart of the design. An index that averaged these zones into one figure would be averaging quantities that genuinely disagree. The result is a number that lands in the middle of a country's real spread and represents none of its actual strengths. The methodology literature on composite indicators has a name for the assumption that lets you add such things together, compensability, the idea that a surplus in one dimension can pay for a deficit in another. Sometimes that holds. For an economy deciding what to fix next, it almost never does. A brilliant innovation base does not buy the open capital markets it lacks.
03Same Score, Opposite Economy
Push the point to its limit and the single number stops being merely lossy and starts being misleading. Search the field for the pairs of economies that sit closest on the composite while differing most across their profiles, and the index hands back mirror images.
Namibia scores 49.8. Russia scores 49.4, four-tenths of a point apart, as close to identical as the composite gets. Yet Namibia is a small open economy that pulls capital (85 on the FDI Accelerator) with a thin innovation base (32), while Russia is its exact inverse, a heavy innovation and resource economy (69) sealed off from foreign capital (9). Same score. Opposite country. The largest profile gap in the entire field hides behind one of its smallest score gaps.
It is not an isolated quirk. Bahrain and New Zealand are half a point apart on the composite and farther apart across their six zones than almost any other pair in the index. The pattern is structural, and it has a single summary statistic.
04What the Average Costs You
The deepest reason to keep the zones separate is not statistical, it is causal. An economy does not perform at the level of its average capability. It performs closer to the level of its weakest necessary link, the bottleneck that throttles everything downstream. The production logic Michael Kremer formalized in 1993 was exactly this, that when steps are complementary, output is governed by the weakest step, not the mean of the steps. A composite buries the weakest step inside the average and tells you the system is fine.
Japan posts 77 on Innovation Capacity and 18 on the FDI Accelerator. China posts 80 and 9. Their composites look respectable. Their bottlenecks are screaming, and the bottleneck is the entire job for anyone trying to build. This is also why the broader tradition that argues against single-number measures of national progress, from the capability approach to the Stiglitz, Sen, and Fitoussi commission on the mismeasurement of economic performance, keeps reaching the same conclusion. Collapsing a multidimensional reality into one figure discards precisely the information a decision-maker needs to act.
A rank tells a country where it stands. A profile tells it what to build. Only one of those is a plan.
05Six Numbers and a Confidence Band
So the IEPA index does not crown a winner. It draws a shape. Six zones, each reported on its own, because each one is a different decision and a different owner. We pair every score with a confidence band, because coverage varies and a number without its uncertainty is a guess wearing a suit. And we curate rather than letting raw flows rank the field, because the openness zone in particular is easily gamed by conduit economies, a problem we treat at length elsewhere.
The discipline costs us the headline. There is no single IEPA rank to tweet, no place on a line for a ministry to celebrate. What it buys is the thing a single number can never deliver. When a region asks Innovative EcoSystems where it stands, we can show it which engine is running, which one is stalled, and which one, if it were fixed, would move everything else. A ranking is a scoreboard. A profile is the start of an operating system. We build the second kind on purpose.
Profiles, correlations, and the internal-spread statistic are computed on the live IEPA engine across 117 economies for the 2024 assessment year, the headline reference vintage, with later years treated as trend extension. Zone scores are normalized 0 to 100. No estimates.
- Korea rises to 21st in IMD competitiveness ranking. Korea Herald, June 2026.
- OECD & European Commission Joint Research Centre. Handbook on Constructing Composite Indicators: Methodology and User Guide.
- Stiglitz, J., Sen, A., & Fitoussi, J.-P. (2009). Report by the Commission on the Measurement of Economic Performance and Social Progress.
- Sen, A. (1999). Development as Freedom. Oxford University Press.
- Kremer, M. (1993). The O-Ring Theory of Economic Development. The Quarterly Journal of Economics, 108(3), 551–575.
- Innovative EcoSystems. The IEPA Index and Methodology. 2026.
- Innovative EcoSystems. The Conduit Illusion, Lopsided, and The FDI Paradox. 2026.
The Honest Empty
For seven economies our own engine assessed over four hundred products each and returned nothing. The emptiness is the diagnosis, so we ship it.
→Explore the IEPA
Six zones, every market this research is scored from.
→Open the Atlas
The live global registry this research is drawn from.
→