The FDI Paradox
A capability-side Lucas Paradox: why innovation and capital have come apart across 117 economies
The development consensus rests on a quiet assumption: that productive capability and the capital that funds it travel together. A half-century of growth theory makes knowledge the engine of long-run prosperity, and the foreign-investment literature makes capability the precondition for capital to pay off, since a host economy needs a threshold of human capital and institutional quality before incoming investment raises growth at all. Build the capacity, the logic runs, and the capital follows. Across 117 economies and 15 years of IEPA data, it does not. We find that innovation capacity and foreign-investment intensity are statistically decoupled (r = 0.23, r² = 0.05), that the weak relationship is concave and dies at the median, and that the deviations are governed by openness and institutions, not capability. This is, in miniature, the puzzle Robert Lucas posed in 1990, ported from the supply of capital to the demand for capability.
- The decoupling. Innovation capacity explains 5 percent of the cross-country variance in FDI intensity. A 10-point gain in capability predicts a 2.5-point gain in capital intensity, against a 22-point standard deviation. The signal is statistically real and substantively negligible.
- The concavity. FDI intensity rises across the bottom half of the capability distribution, then flattens. The most innovative quartile of economies attracts barely more capital, relative to size, than the second-least innovative, despite nearly doubling its measured capability.
- The structure. Who over- and under-attracts is not random. Over-performers are conduits, havens, and small frontier markets; under-performers are large, closed, or state-directed economies. China sits at the extreme: 8th of 117 on capability, last on capital intensity.
- The implication. Conversion from capability to capital is not automatic. It is an institutional and structural function that most regions never build, and it is the function Innovative EcoSystems exists to supply.
01The Promise, and the Theory Behind It
Every regional development agency on earth runs a version of the same playbook: fund the research base, stand up the incubator, train the talent, court the multinational. The playbook is not naive. It is a faithful application of the dominant theory of growth. Since the production of ideas became endogenous to the economy in modern growth theory, capability, the stock of knowledge and the institutions that deploy it, has been treated as the deep driver of long-run prosperity, and the economic-complexity literature has shown empirically that the productive knowledge embedded in what a country can make predicts how rich it becomes.
The foreign-investment literature then closed the loop. Its canonical finding is that FDI raises growth only above a minimum threshold of human capital, because capability is what lets a host economy absorb the technology that arrives with the capital; the parallel finding on the capital side is that investment flows are gated by institutional quality. The combined message of forty years of theory is that capability and capital are complements that should be found together.
If that were the whole story, the world's most capable economies would also be its capital magnets. We measured whether they are.
02What We Measure
Innovation Capacity is the IEPA composite of an economy's research, talent, knowledge-creation, and institutional inputs. It is our operational proxy for the productive capability that growth theory cares about.
FDI Accelerator measures foreign direct investment relative to the size of the receiving economy, normalized across the field. The choice of intensity over volume is deliberate and consequential. Absolute volume simply tracks economic size: the United States receives the most FDI on earth because it is the largest economy, and UNCTAD reports US greenfield value rose 93 percent in 2024 to roughly 266 billion dollars. Intensity asks the more revealing question, how much capital an economy pulls in per unit of itself, and it is intensity, not volume, that the development playbook implicitly promises to raise.
03Finding One: The Decoupling
Regressing FDI intensity on innovation capacity across all 117 economies in the latest assessment year yields a relationship that is real, positive, and almost meaningless.
The coefficient clears the bar of statistical significance and fails every test of importance. A full 10-point improvement in innovation capacity, the distance from Vietnam to Israel, predicts a 2.5-point rise in FDI intensity, against a standard deviation in FDI intensity of nearly 22 points. Put differently: knowing an economy's innovation score shrinks your uncertainty about its capital intensity from 21.7 points to 21.1. Innovation capacity explains five percent of the variation in how much foreign capital an economy attracts relative to its size, and leaves the other ninety-five to something else.
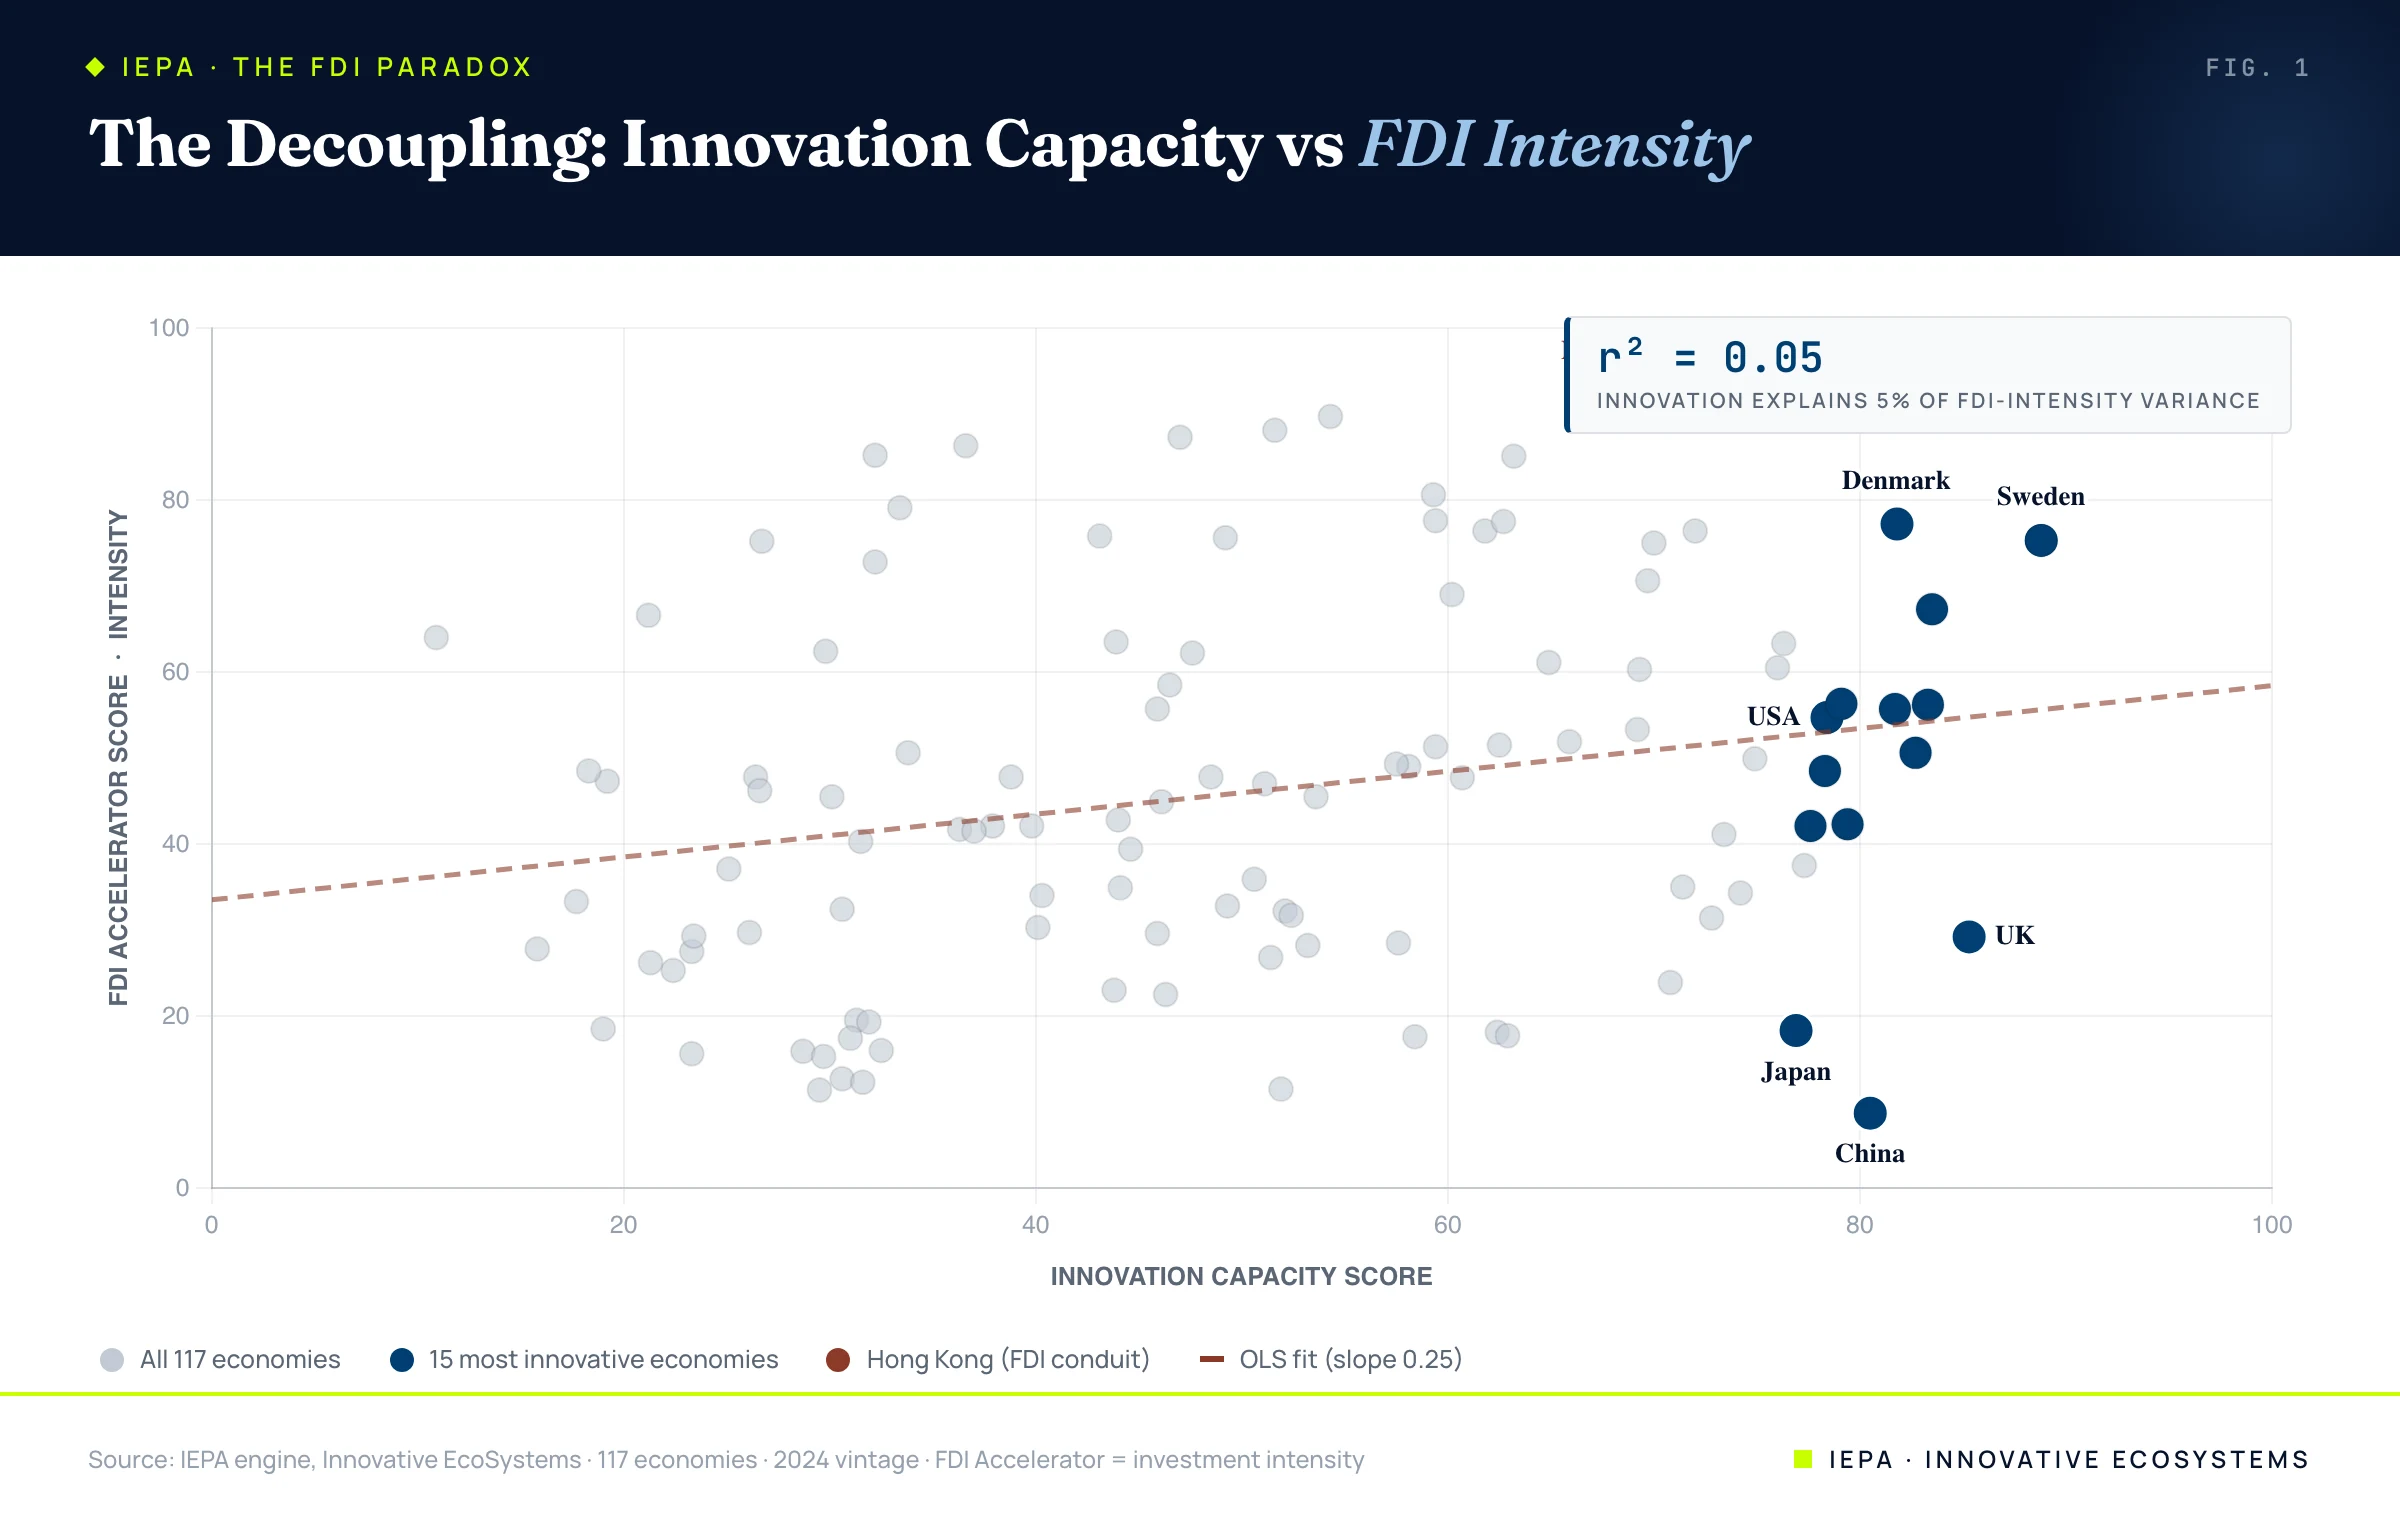
This single statistic dismantles the linear development playbook. The inputs and the capital are not on the same chain.
04Finding Two: The Relationship Is Concave, and It Dies at the Median
A weak average can hide a strong relationship in part of the range. So we split the 117 economies into quartiles by innovation capacity and read off the mean FDI intensity of each. The result is sharper than the correlation alone suggests, and more damning for the playbook.
| Innovation quartile | Mean innovation | Mean FDI intensity |
|---|---|---|
| Q1 · least innovative | 25.9 | 36.3 |
| Q2 | 42.0 | 47.7 |
| Q3 | 58.5 | 51.6 |
| Q4 · most innovative | 77.1 | 49.2 |
FDI intensity climbs sharply from the bottom quartile to the second, rising more than 11 points as economies escape the very bottom of the capability distribution. Then it stops. Across the entire top half, from a mean capability of 42 to a mean of 77, an 83 percent increase in measured innovation, FDI intensity barely moves. The most innovative quartile of economies on earth attracts essentially the same foreign capital, relative to size, as the second-least innovative.
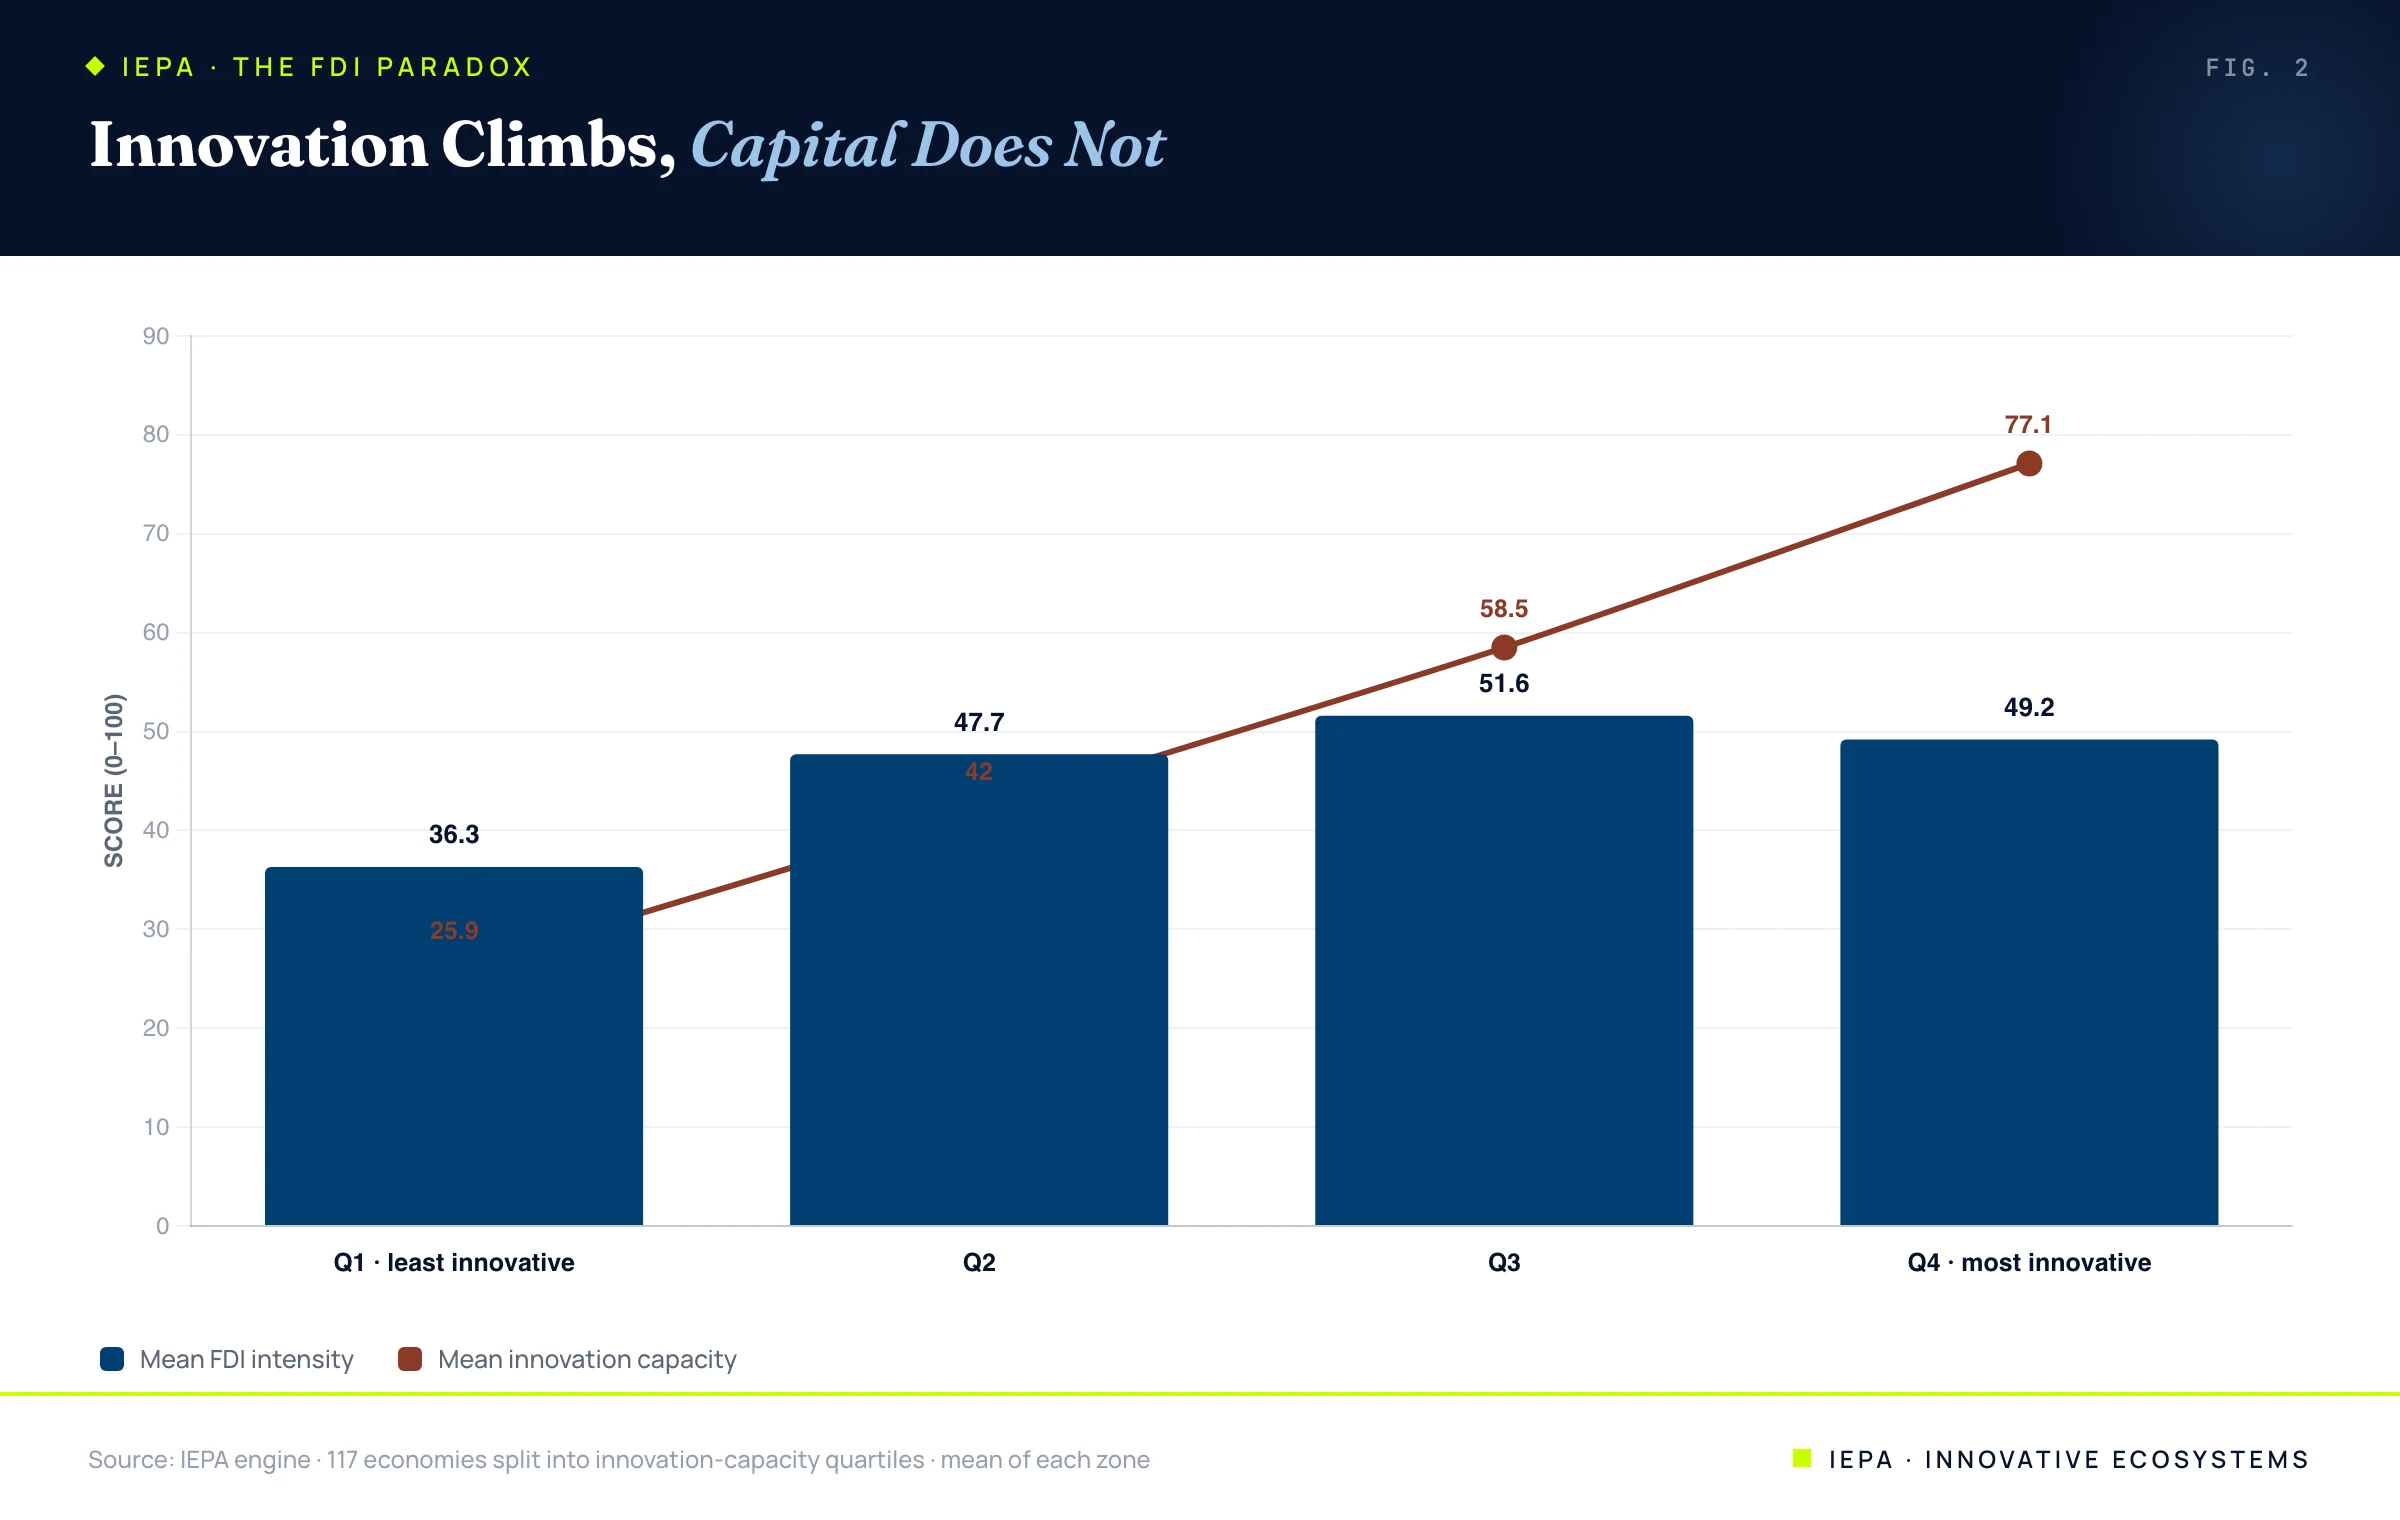
The implication is precise. The little correlation that exists is almost entirely a bottom-half phenomenon, the poorest, least capable economies converging toward the middle of the capital distribution. Among economies that have actually built capability, the relationship is gone. Whatever attracts capital to a capable economy, it is not the next increment of capability.
05Finding Three: The Residuals Are Governed by Openness, Not Capability
The most revealing object in a weak regression is not the line but the distance from it. For every economy we computed the residual: how much more or less FDI intensity it attracts than its capability predicts. If the deviations were noise, they would be a random scatter of countries. They are not. They sort, cleanly, into two recognizable kinds of economy.
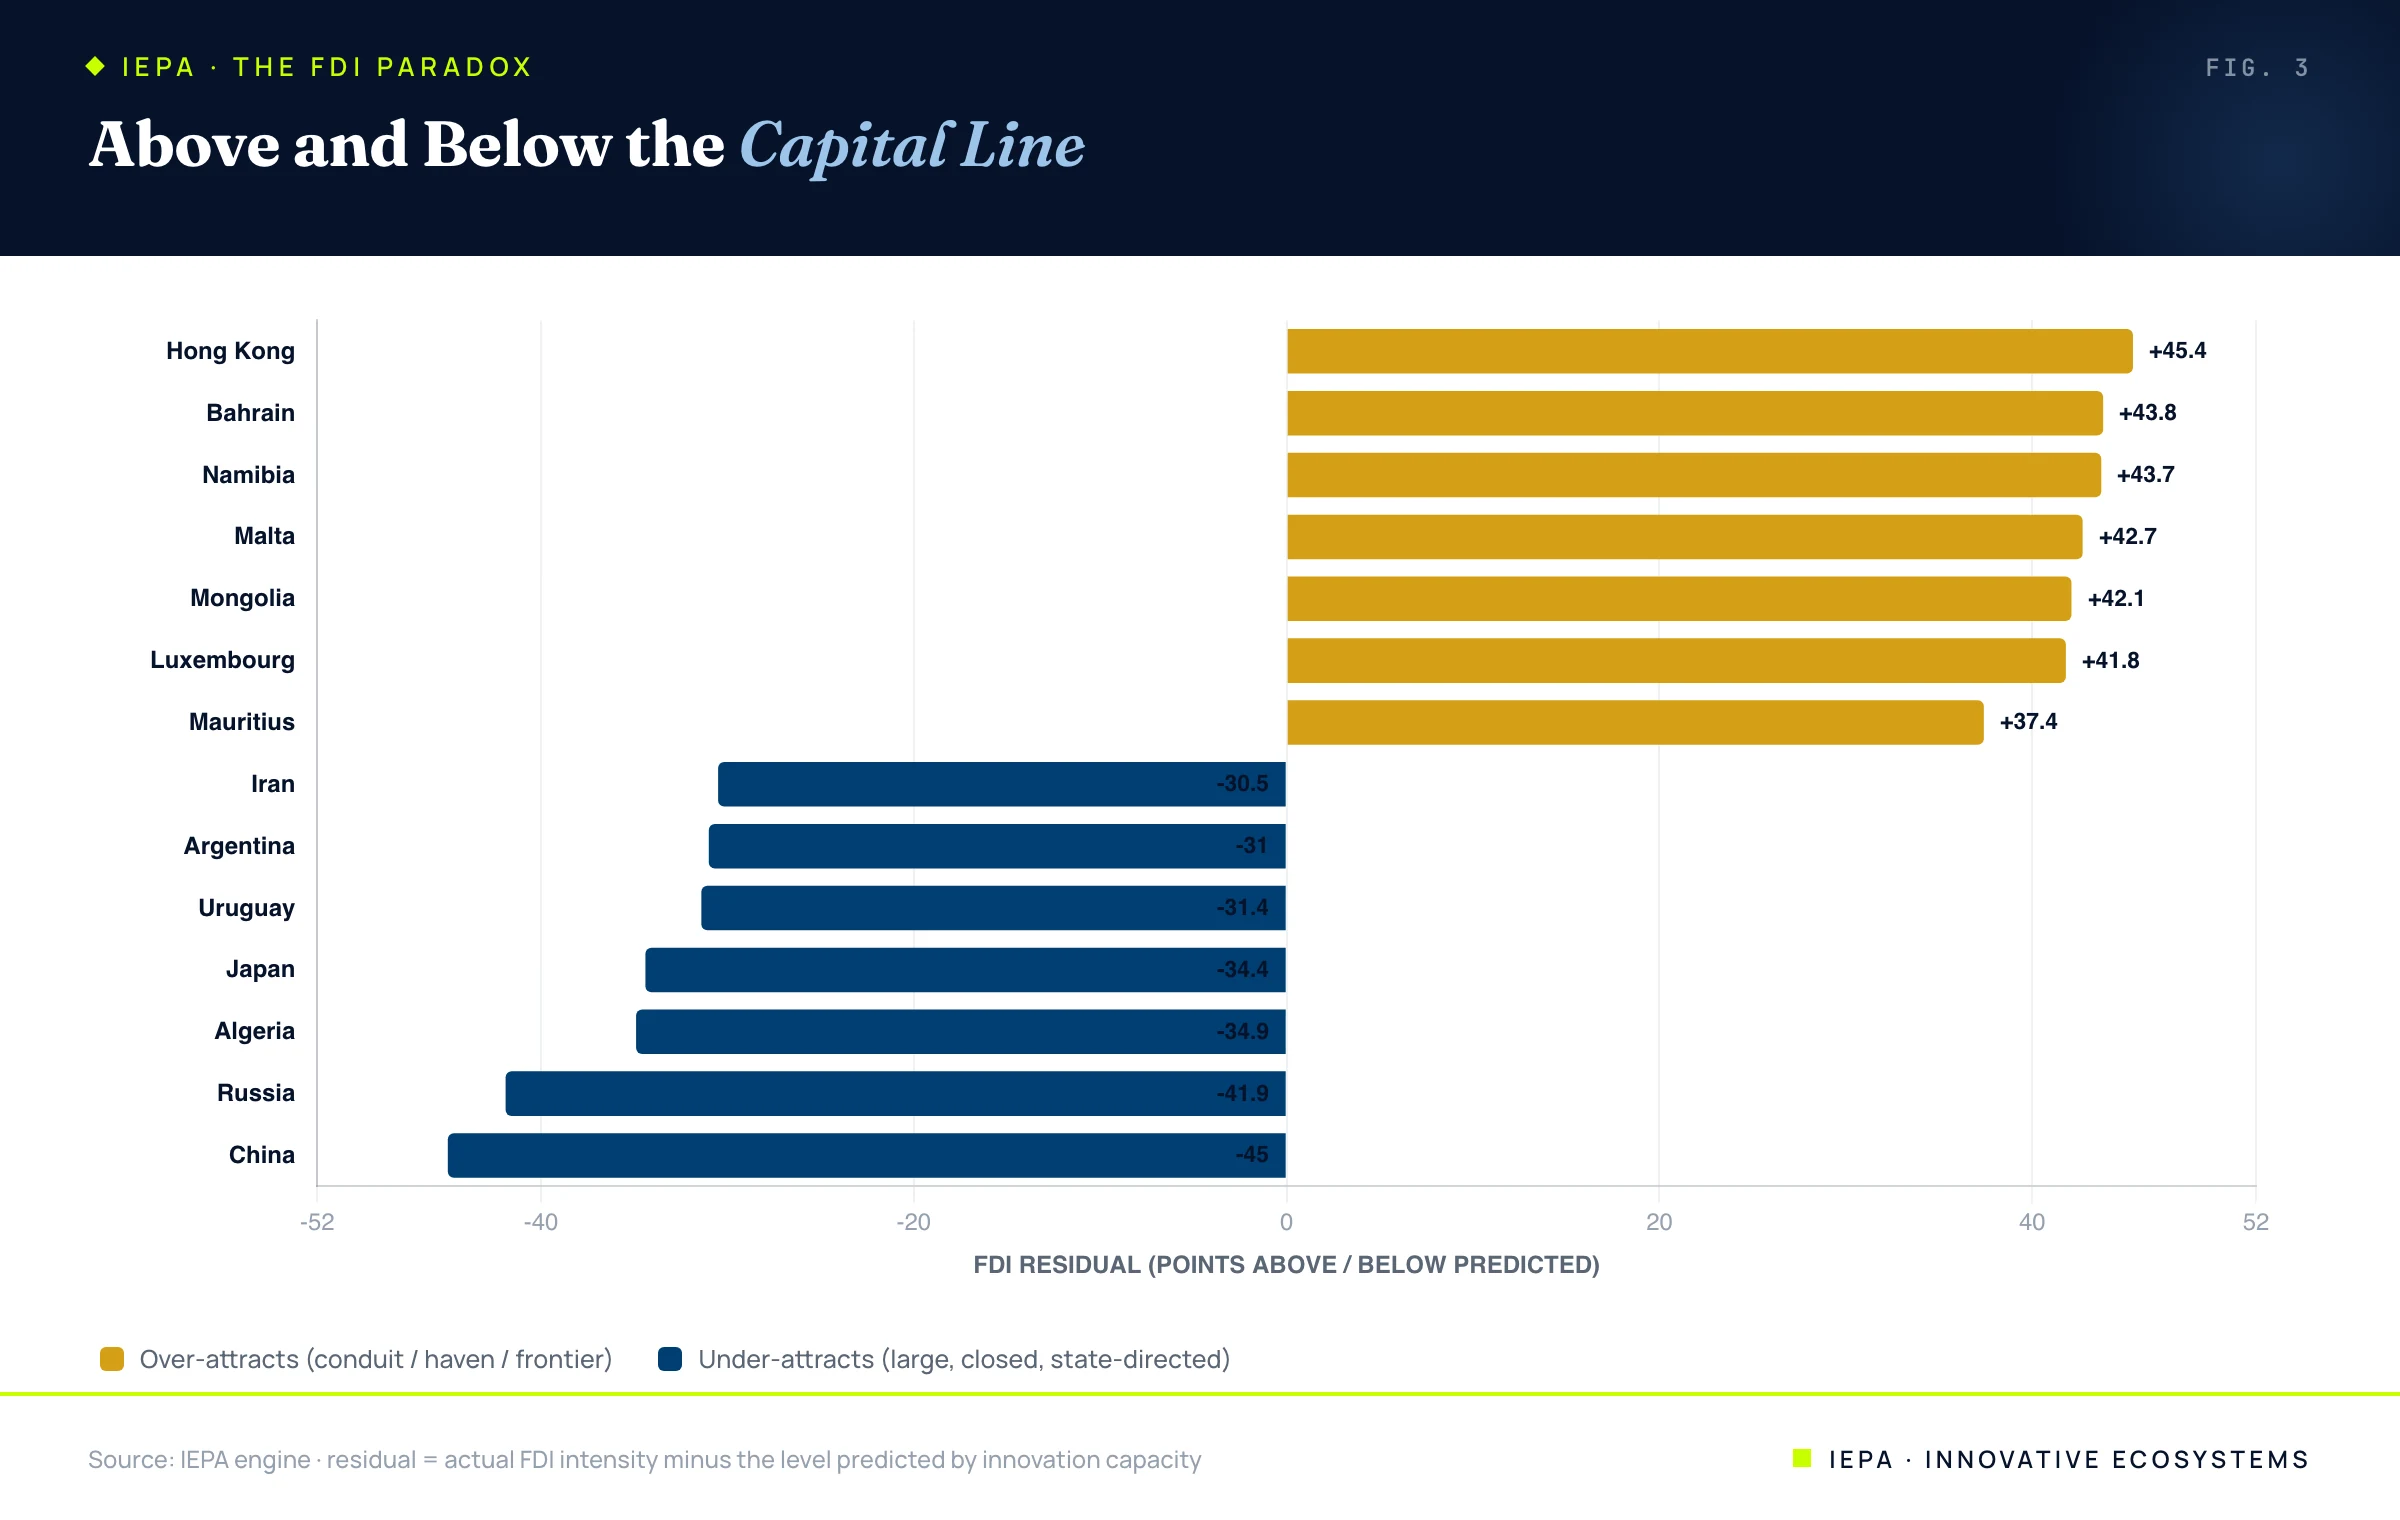
The economies that attract far more capital than their capability warrants are, without exception, financial conduits (Hong Kong, Malta, Luxembourg, Mauritius) and small open frontier markets running high ratios off a tiny denominator (Namibia, Bahrain, Mongolia). The economies that attract far less are large, closed, or state-directed: China and Russia at the extreme, with Iran, Algeria, Argentina, and Uruguay close behind, and an open but structurally capital-shy Japan among them. Capability does not appear on either list as the operative variable. What determines whether an economy punches above or below its capital weight is openness, institutional access, and the absence of geopolitical friction, not the quality of its production frontier.
06This Is a Capability-Side Lucas Paradox
The finding has a distinguished ancestor. In 1990, Robert Lucas asked why capital does not flow from rich to poor countries, when neoclassical theory says the scarcity of capital in poor economies should make its returns, and therefore its inflows, enormous. By his arithmetic the marginal product of capital in India should have been some fifty times that of the United States; capital should have flooded in; it did not. The puzzle has anchored a generation of international economics.
Our result is the same puzzle, measured on a different axis. Lucas asked why capital ignores the places where it is scarcest; we find that capital also ignores the places where capability is highest. And the resolution rhymes with the one the discipline eventually settled on for Lucas: the puzzle is explained less by economic fundamentals than by institutional quality. Capital flows to where it is safe and legible, not to where its theoretical return is highest. Our residuals say the same thing in capability's language. The economies that under-attract relative to their capability are precisely those where institutions, openness, or geopolitics make capital unsafe or unwelcome.
Capability is necessary for prosperity and nearly irrelevant to capital attraction. The two run on different rails, and the switch between them is institutional.
This reconciles, rather than contradicts, the absorptive-capacity literature. That tradition is right that capability determines whether FDI, once arrived, does any good. Our point is upstream of it: capability does not determine whether the FDI arrives at all. A country can build a world-class production frontier and still repel the capital that is supposed to fund it, because the arrival of capital is gated by a different set of institutions than the ones that build capability.
07The Conduit Illusion
Before drawing conclusions from the FDI leaderboard, it has to be cleaned, because a large share of what the world records as foreign investment is not investment at all. In landmark work, Damgaard, Elkjaer and Johannesen (2019) estimate that roughly 38 percent of global FDI, about 15 trillion dollars, is “phantom” capital routed through empty corporate shells for tax purposes. The thing to picture is mundane: a holding company in a Luxembourg or Amsterdam office that may employ no one, through which capital passes on its way to its real destination, and which the investment ledger nonetheless records as a vast and productive inflow. Luxembourg and the Netherlands alone host more than half of it; ten jurisdictions, including Hong Kong, Ireland, Singapore, and Mauritius, host more than 85 percent. UNCTAD now reports global FDI both with and without these conduit flows, and the difference is stark: headline 2024 inflows of roughly 1.5 trillion dollars fall by about 11 percent once conduit flows through a handful of European economies are stripped out.
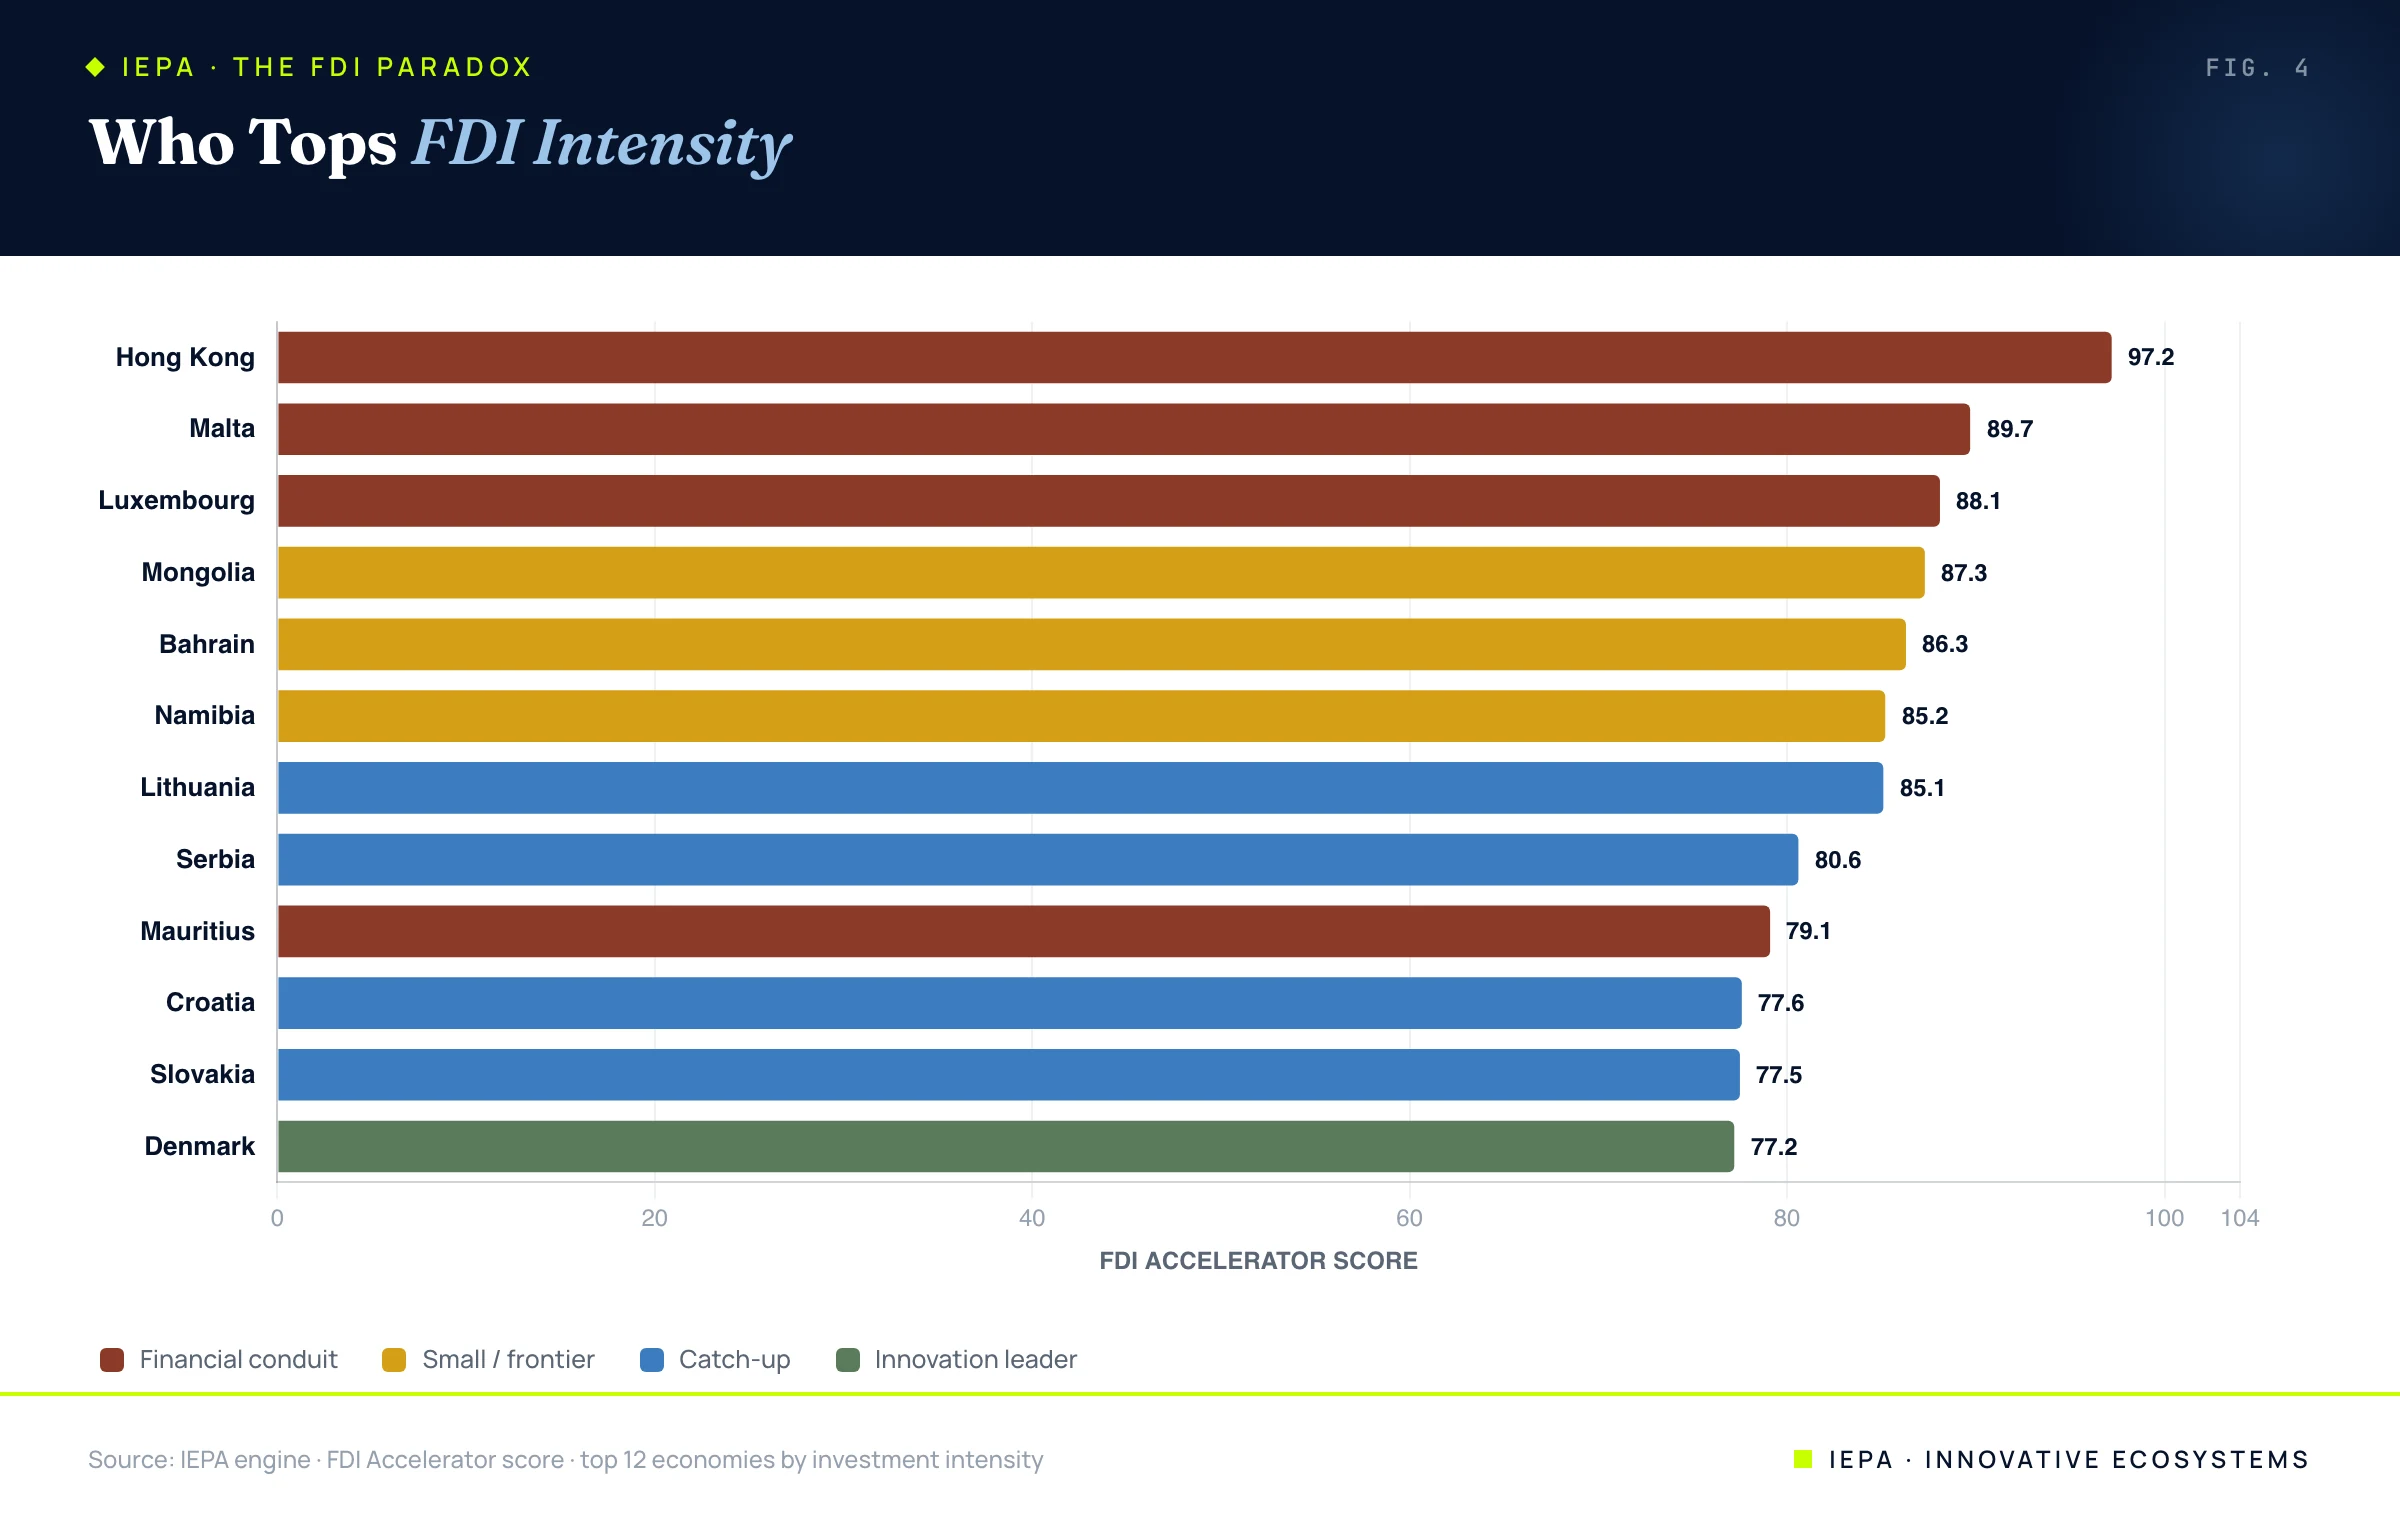
We call the result the Conduit Illusion: the raw FDI leaderboard is a ranking of fiscal geography, not productive attraction. But a crucial robustness check shows the Illusion is a distortion layered on top of the decoupling, not its cause. Removing the largest conduit and haven economies from the regression leaves the correlation between capability and capital intensity essentially unchanged, at 0.212 against the full-sample 0.230. The decoupling is not a conduit artifact. It is a structural feature of the other 107 economies, on top of which the conduits add their own layer of noise.
08The China Case
China is the paradox in its purest form, and the single largest residual in the dataset. It ranks 8th of 117 on innovation capacity, with a score of 80.5, among the global elite on research output, patent volume, and knowledge creation. It ranks last of 117 on FDI intensity, with a score of 8.7, dead bottom of the field. Its regression residual, −45 points, is the most negative in the field: no economy on earth attracts so much less capital than its capability predicts.
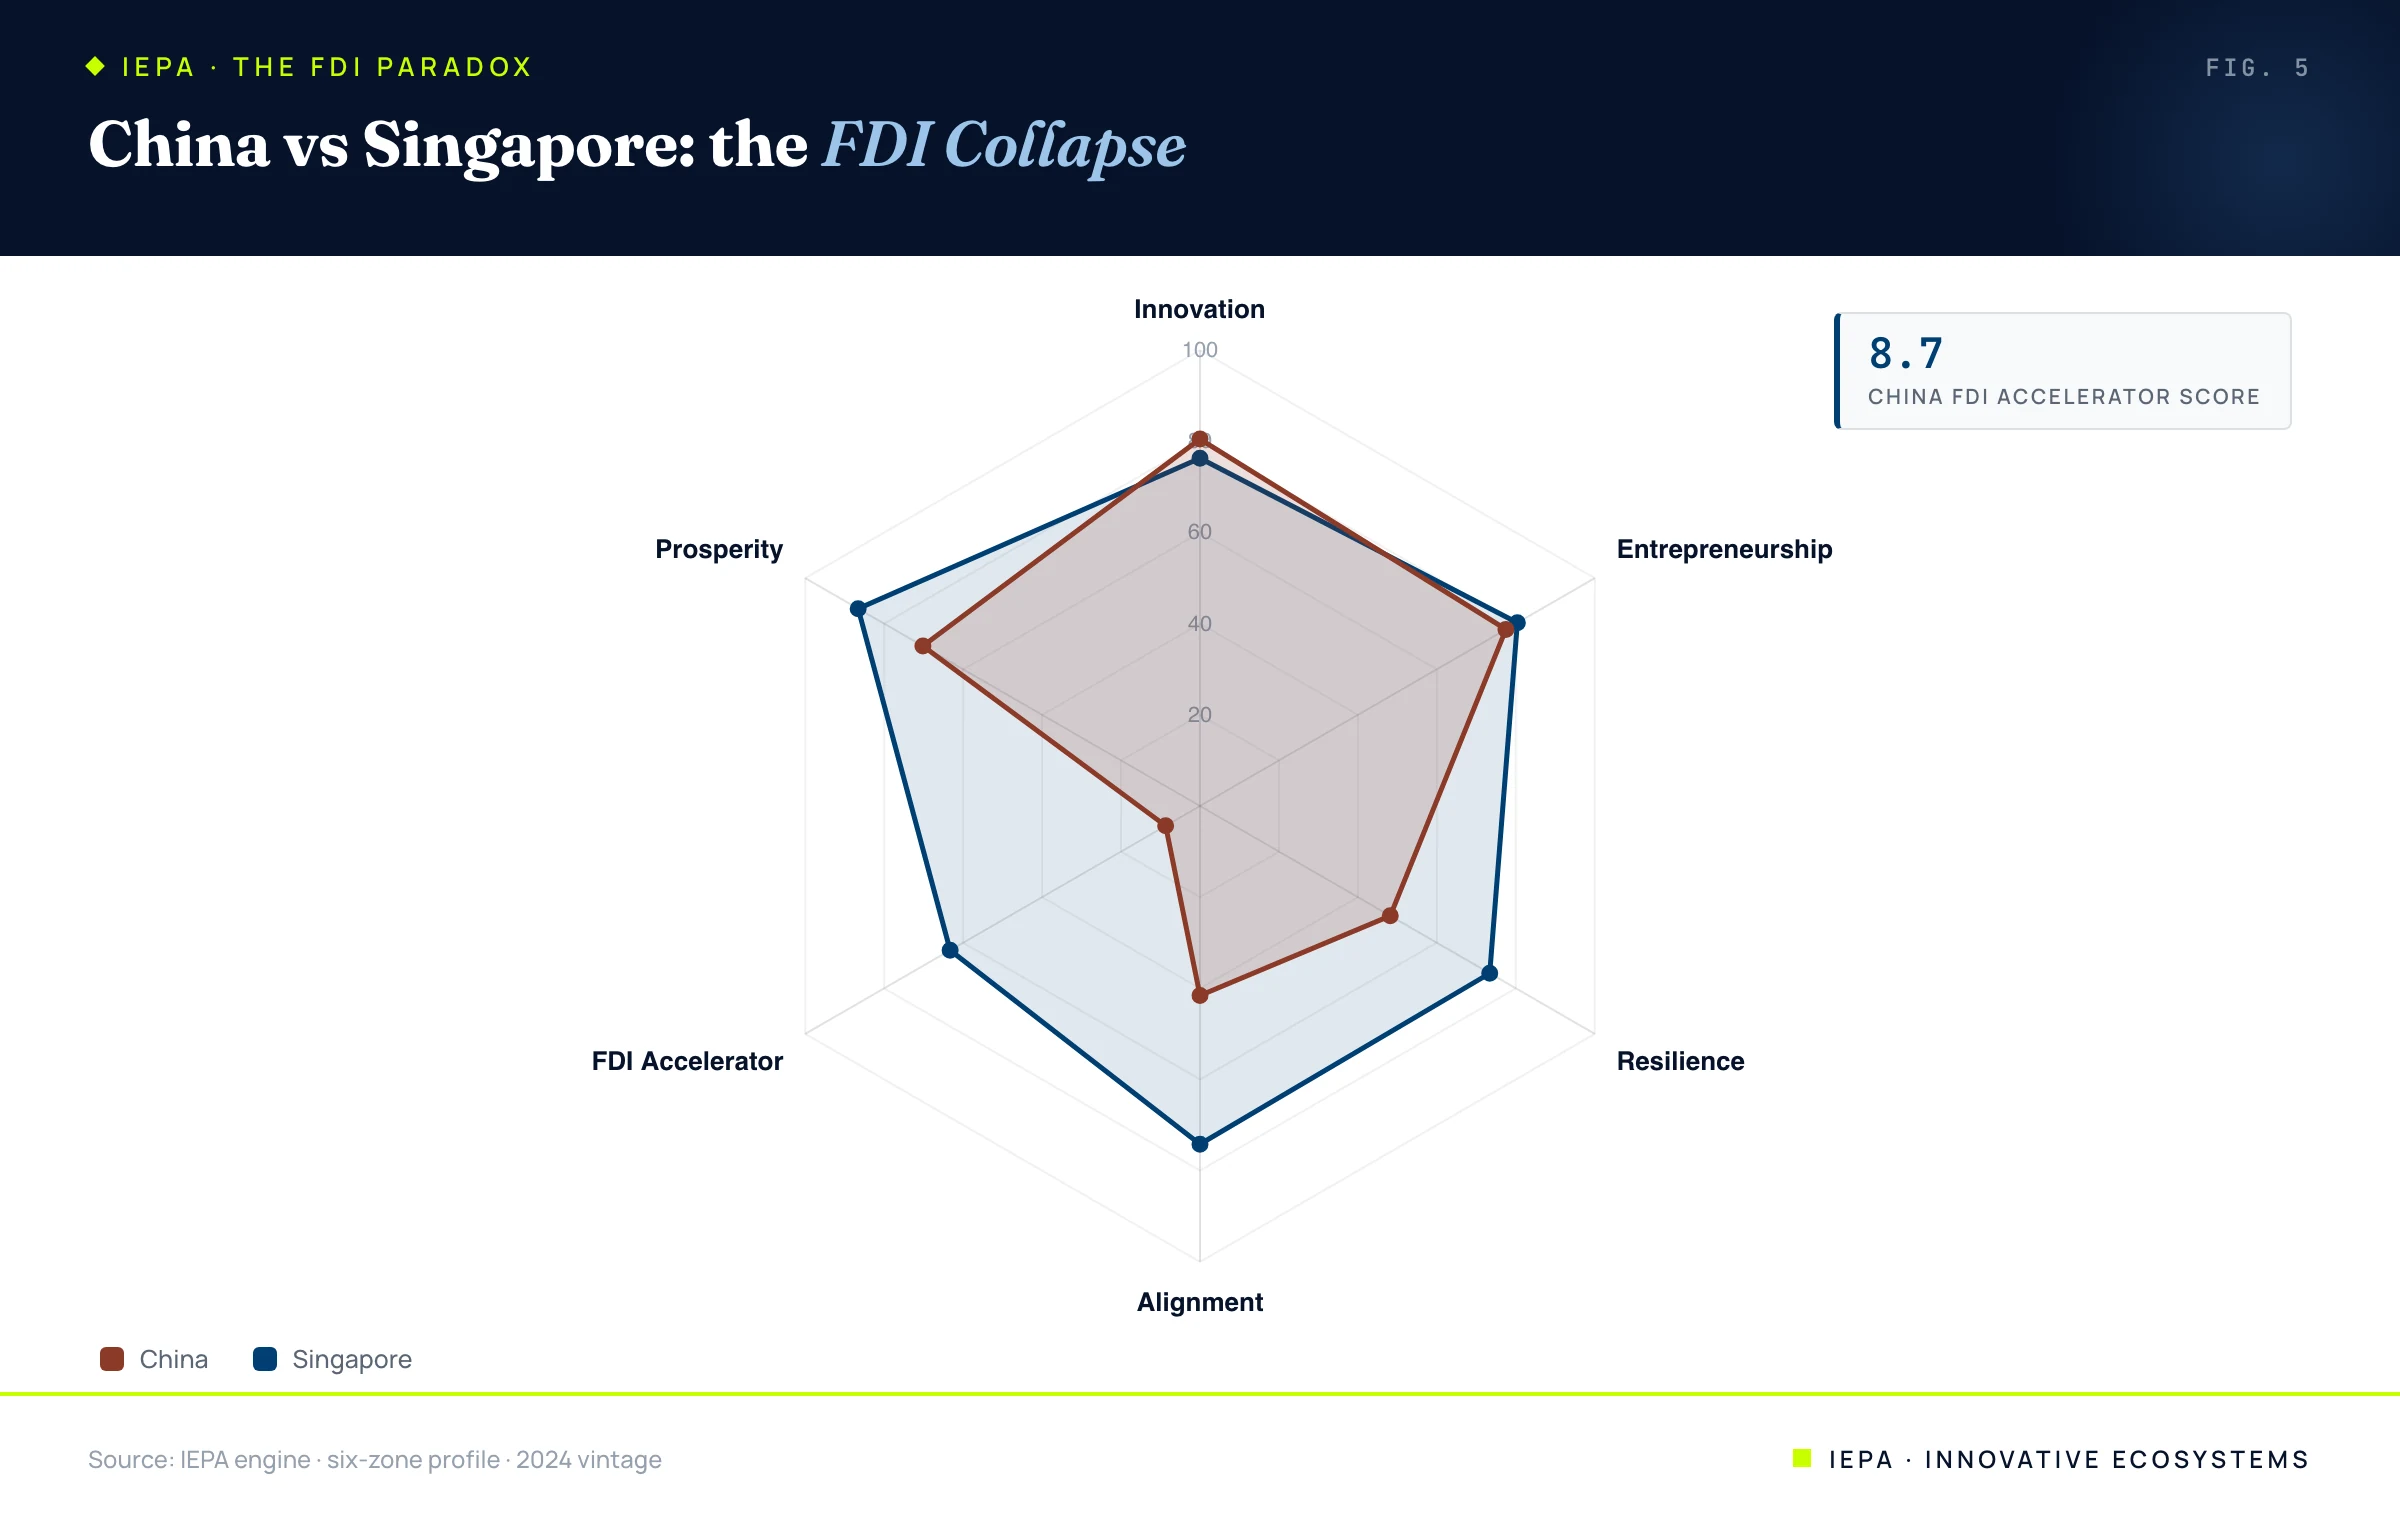
The external data corroborates the collapse. UNCTAD balance-of-payments figures show Chinese inward FDI falling from roughly 163 billion dollars in 2023 to approximately 116 billion in 2024, a decline of nearly 29 percent, as foreign firms remitted earnings abroad and geopolitical risk repriced the market. China and Russia, the two largest negative residuals, are the archetype the framework predicts: a frontier production base behind a capital-repellent institutional wall. Capability and capital are not the same asset, and the two largest economies that prove it are the two that the conventional model would have insisted were sure things.
The capability has only compounded since. By 2026, Chinese firms had displaced the American pioneers of category after category, from action cameras to home robotics to open-source artificial intelligence, even as the foreign capital the conventional model says should chase that capability kept heading for the exits. The production frontier advances; the capital recedes. That is the paradox, not in a single cross-section but in this year's headlines.
09The Decoupling Is Structural and Persistent
A cross-sectional finding invites the objection that it is a quirk of one year. It is not. Recomputing the capability-capital correlation in every year of the IEPA panel shows it hovering in a narrow band, 0.14 in 2014, 0.17 in 2010, 0.22 in 2018, 0.23 in 2024, never once approaching a level that would make capability a serious predictor of capital. The relationship is not weakening or strengthening into something else. It is a stable structural feature of the global economy, weak in every year we can measure, and the mechanisms behind it, the denominator arithmetic of intensity, the conduit distortion, and the institutional gating of capital, are all structural rather than cyclical.
10What This Means: The Conversion Machine
The FDI Paradox is not an academic curiosity. It is the central problem of regional economic development, and it defines the work of Innovative EcoSystems.
If capability summoned capital, regions would only need to fund inputs and wait. The data says they cannot wait, because the conversion does not happen on its own. Between an economy's production frontier and the capital that should fund it lies a gap, and the gap is not closed by more capability. It is closed by structure: by the institutions, vehicles, and underwritten commitments that make a region's latent capacity legible and enterable to capital. We call that missing apparatus the Conversion Machine, and building it is the IE thesis in one phrase.
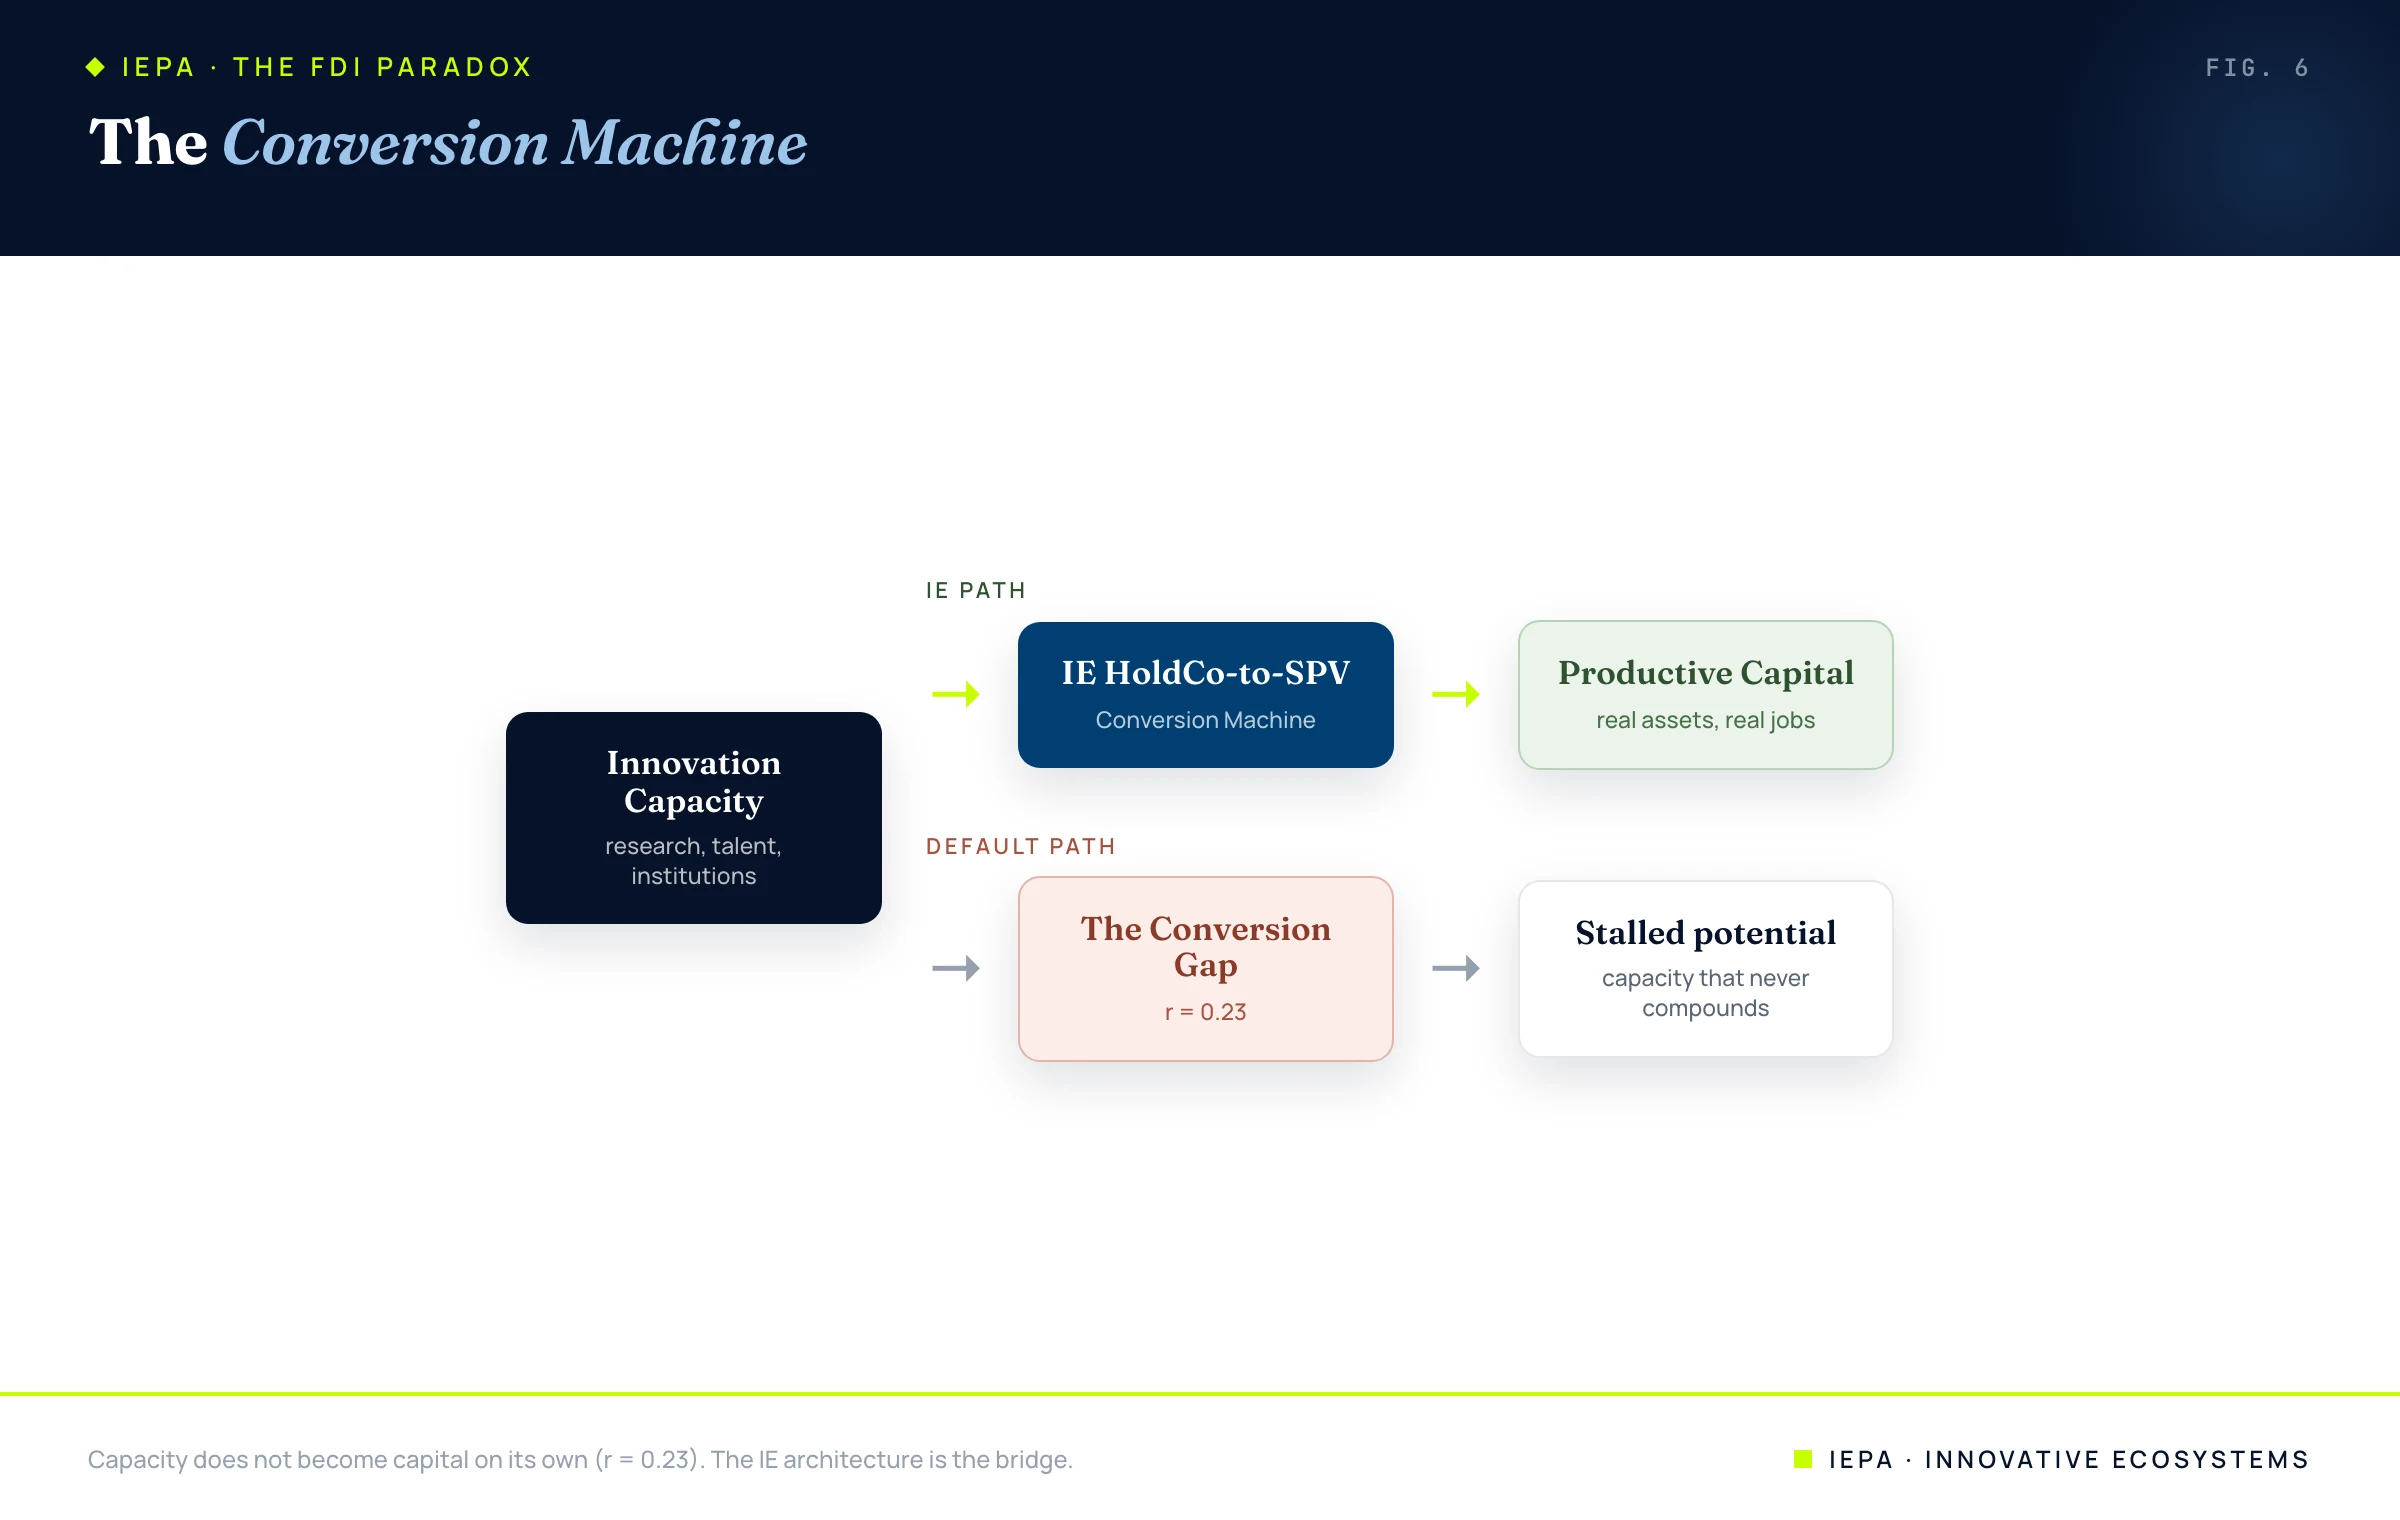
Our HoldCo-to-SPV architecture is that machine in practice. It takes the latent capacity of a region, its anchors, its institutions, its underwritten public commitments, and packages it into investable pipelines that capital can actually enter. We do not ask a region to hope that innovation will summon investment. We build the institutional bridge the data says does not exist by default, and we hold equity in the result. The paradox also reframes how regions should benchmark themselves: a region chasing a higher raw FDI ratio may simply be chasing conduit flows that build nothing. The target is productive capital that lands in real assets and real jobs, and the path to it runs through structure, not slogans.
11Methodology and Limitations
The IEPA engine computes six zone scores per economy from 99 underlying indices, normalized per index within a transparent, coverage-aware confidence framework; the benchmark economies in this analysis carry confidence around 0.90. The full methodology is published separately.
Four honest limitations frame the result. First, the analysis is cross-sectional and correlational; it identifies a structural decoupling, not a causal mechanism, and the residual interpretation is a reading of which economy types populate the tails, not a controlled experiment. Second, the FDI Accelerator measures intensity, not absolute volume; by volume the largest advanced economies dominate, and the paradox is specifically a statement about capital per unit of economic size. Third, the headline relationship is a weak positive, not an inverse: capability and capital intensity do not move in opposite directions, they move almost independently, which is the finding. Fourth, FDI data is globally contaminated by conduit and phantom flows; we address this through transparent curation and an explicit robustness check rather than by silently editing the underlying numbers.
The data behind this paper is live and reproducible from the IEPA engine across all 117 economies and 15 years.
All economy-level scores, the regression, the quartile decomposition, the residuals, and the time-series correlations are computed from the proprietary IEPA engine maintained by Innovative EcoSystems. Academic and external sources are listed below.
- Romer, P. M. (1990). Endogenous Technological Change. Journal of Political Economy, 98(5), S71–S102.
- Lucas, R. E. (1990). Why Doesn't Capital Flow from Rich to Poor Countries? American Economic Review, 80(2), 92–96.
- Borensztein, E., De Gregorio, J., & Lee, J.-W. (1998). How Does Foreign Direct Investment Affect Economic Growth? Journal of International Economics, 45(1), 115–135.
- Alfaro, L., Kalemli-Ozcan, S., & Volosovych, V. (2008). Why Doesn't Capital Flow from Rich to Poor Countries? An Empirical Investigation. Review of Economics and Statistics, 90(2), 347–368.
- Hausmann, R., Hidalgo, C. A., et al. (2014). The Atlas of Economic Complexity: Mapping Paths to Prosperity. MIT Press.
- Damgaard, J., Elkjaer, T., & Johannesen, N. (2019). The Rise of Phantom Investments. IMF Finance & Development.
- UNCTAD (2024). World Investment Report 2024.
- WIPO (2024). Global Innovation Index 2024.
- Chinese consumer-tech brands now dominate categories US firms pioneered. Rest of World, June 2026.
- Innovative EcoSystems. The IEPA Index and Methodology.
The Conduit Illusion
Headline FDI numbers routed through financial conduits, and how the index refuses to be fooled by them.
→Explore the IEPA
Six zones, every market this research is scored from.
→Open the Atlas
The live global registry this research is drawn from.
→