The Conduit Illusion
Why Mongolia, Namibia, and Mauritius all outrank Germany on foreign investment, and why we refuse to publish it that way
The IEPA's FDI Accelerator zone measures foreign investment relative to the size of the receiving economy, which is the right question, until you read the raw leaderboard and discover it rewards two things that have nothing to do with productive attraction: fiscal geography and a small denominator. The economies that top the raw zone are financial conduits, where capital passes through on its way somewhere else for tax reasons, and tiny economies posting enormous ratios off a small base. Of the twelve highest scores, exactly one belongs to a genuine innovation leader. Publishing that list as a ranking of investment attractiveness would be a category error, and a damaging one. We do not. We curate.
- The raw board is fiscal geography. Hong Kong (97), Malta (90), and Luxembourg (88) lead the FDI zone. All three are among the world's largest conduits for capital that lands somewhere else.
- Small denominators do the rest. Mongolia (87), Bahrain (86), Namibia (85), and Mauritius (79) post huge ratios off small economies. Germany scores 42. The ranking inverts reality.
- Most of what the world calls FDI is not investment. The IMF estimates that roughly 38 percent of global foreign direct investment, about 15 trillion dollars, is “phantom” capital routed through empty corporate shells.
- Curation is not cosmetic; it is the product. We keep every economy fully scored and visible, but headline surfaces show the tiers we can stand behind, with the distortion labeled rather than edited out. An index that lets the math lie has told you how it will treat every other number it publishes.
Rank the world's economies by the raw foreign-investment ratio they post, and the top of the table is nonsense. Hong Kong leads. Then Malta, then Luxembourg, then Mongolia, then Bahrain, then Namibia. Germany, the industrial engine of Europe, sits far down the list, below Namibia and Mauritius. The number is not exactly lying. It is measuring the wrong thing, and the gap between what it measures and what it appears to measure is the single most important judgment an honest index has to make.
01The Leaderboard That Makes No Sense
Here is the top of the FDI Accelerator zone, exactly as the raw numbers produce it, with no curation applied.
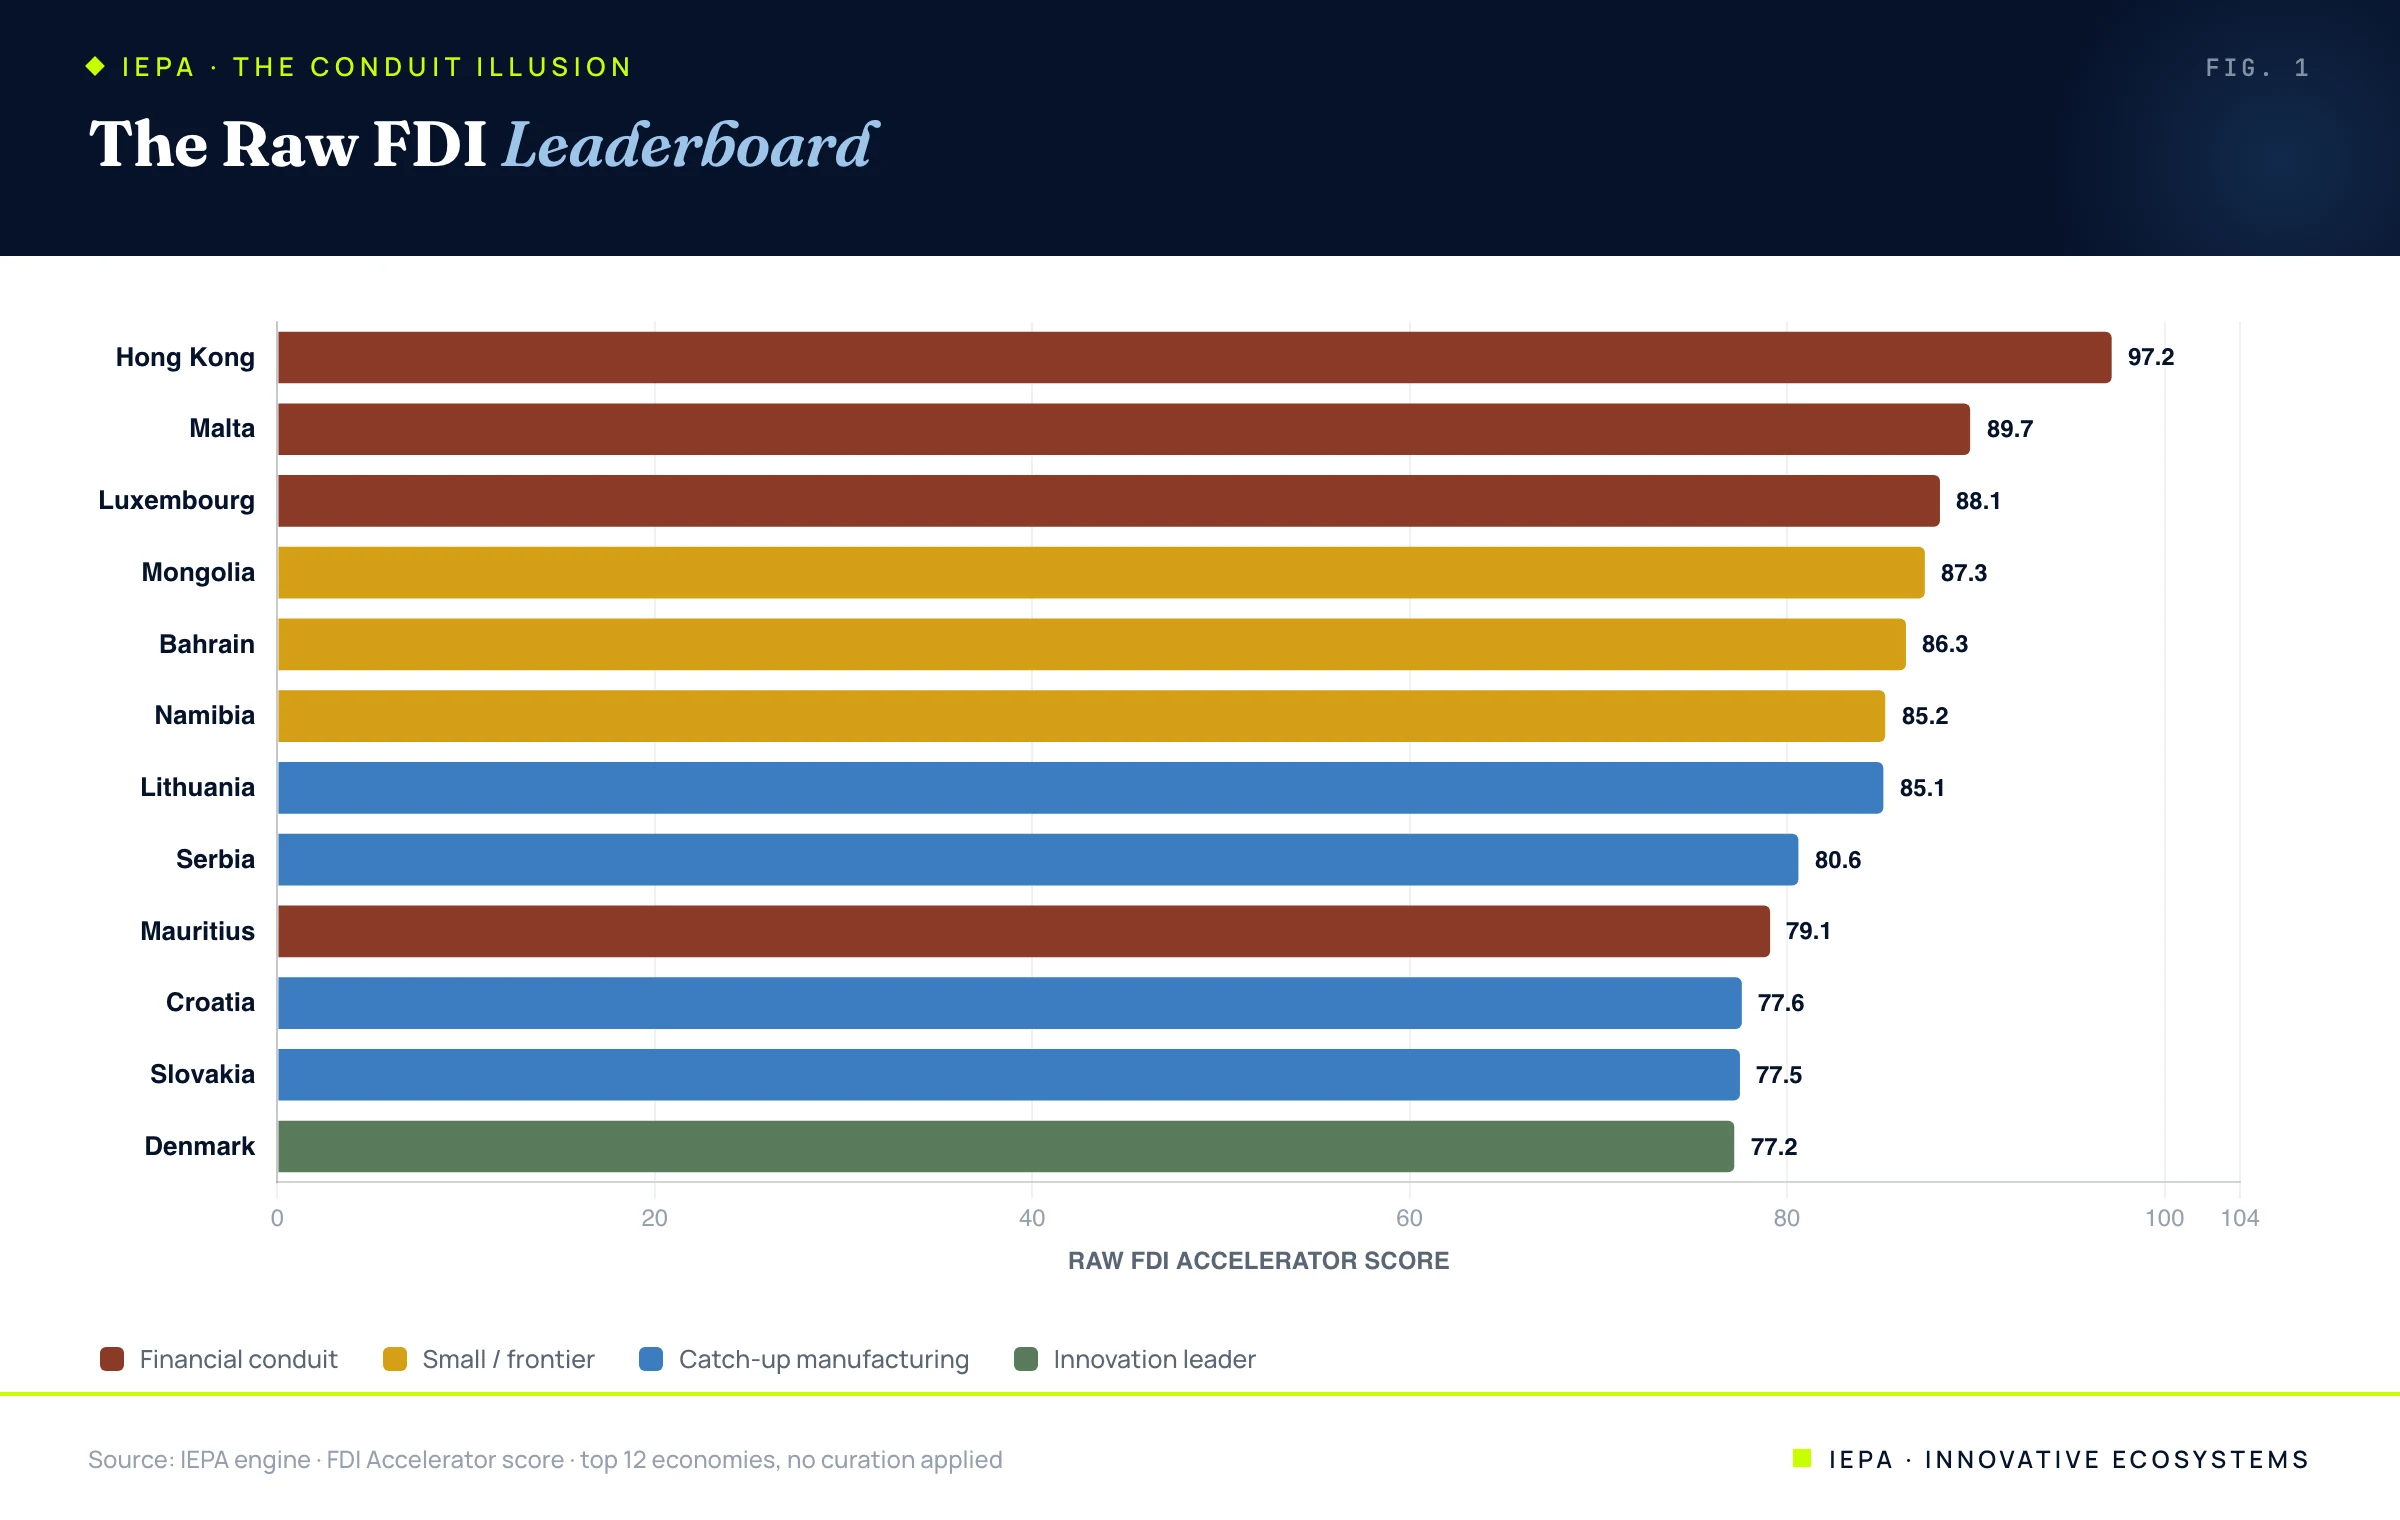
Read it as a ranking of where productive capital wants to be and it is absurd. Hong Kong, Malta, and Luxembourg are not the three most attractive places on earth to build a company; they are three of the largest pipes through which capital flows to its real destination. Mongolia, Bahrain, and Namibia are not out-competing Germany for industrial investment; they are small economies where a modest absolute inflow becomes an enormous ratio because the denominator is small. The board is sorted, just not by the thing the headline implies. It is sorted by fiscal geography and economic size, in that order.
02Two Ways to Top a Foreign-Investment Ranking Without Attracting Investment
The distortion has two distinct mechanisms, and it helps to separate them. The first is the conduit. A handful of jurisdictions exist, in significant part, to route capital through favorable tax treatment on its way elsewhere. The investment is recorded as arriving, and recorded again as leaving, and almost none of it builds anything locally. In landmark work, the IMF estimated that roughly 38 percent of global FDI, about 15 trillion dollars, is “phantom” capital of exactly this kind, with Luxembourg and the Netherlands alone hosting more than half of it. The thing to picture is mundane: a holding company in an office that may employ no one, through which billions pass on their way to a factory in a different country entirely.
The second mechanism is the small denominator. Because the zone measures investment relative to the size of the receiving economy, a country with a tiny economy can post a spectacular ratio on an absolute inflow that, in a large economy, would not register. A single resource project or financial-services boom can lift a small state to the top of the table while a hundred billion dollars landing in Germany barely moves its ratio. This is not fraud; it is arithmetic. But it means the raw ranking systematically rewards being small and systematically punishes being large, which is the opposite of what a measure of investment attractiveness should do.
The raw FDI leaderboard is a ranking of fiscal geography and economic size, dressed up as a ranking of investment attractiveness. The two have almost nothing to do with each other.
03Germany Ranks Below Namibia
The cleanest way to see the problem is a single comparison the raw data forces on you.
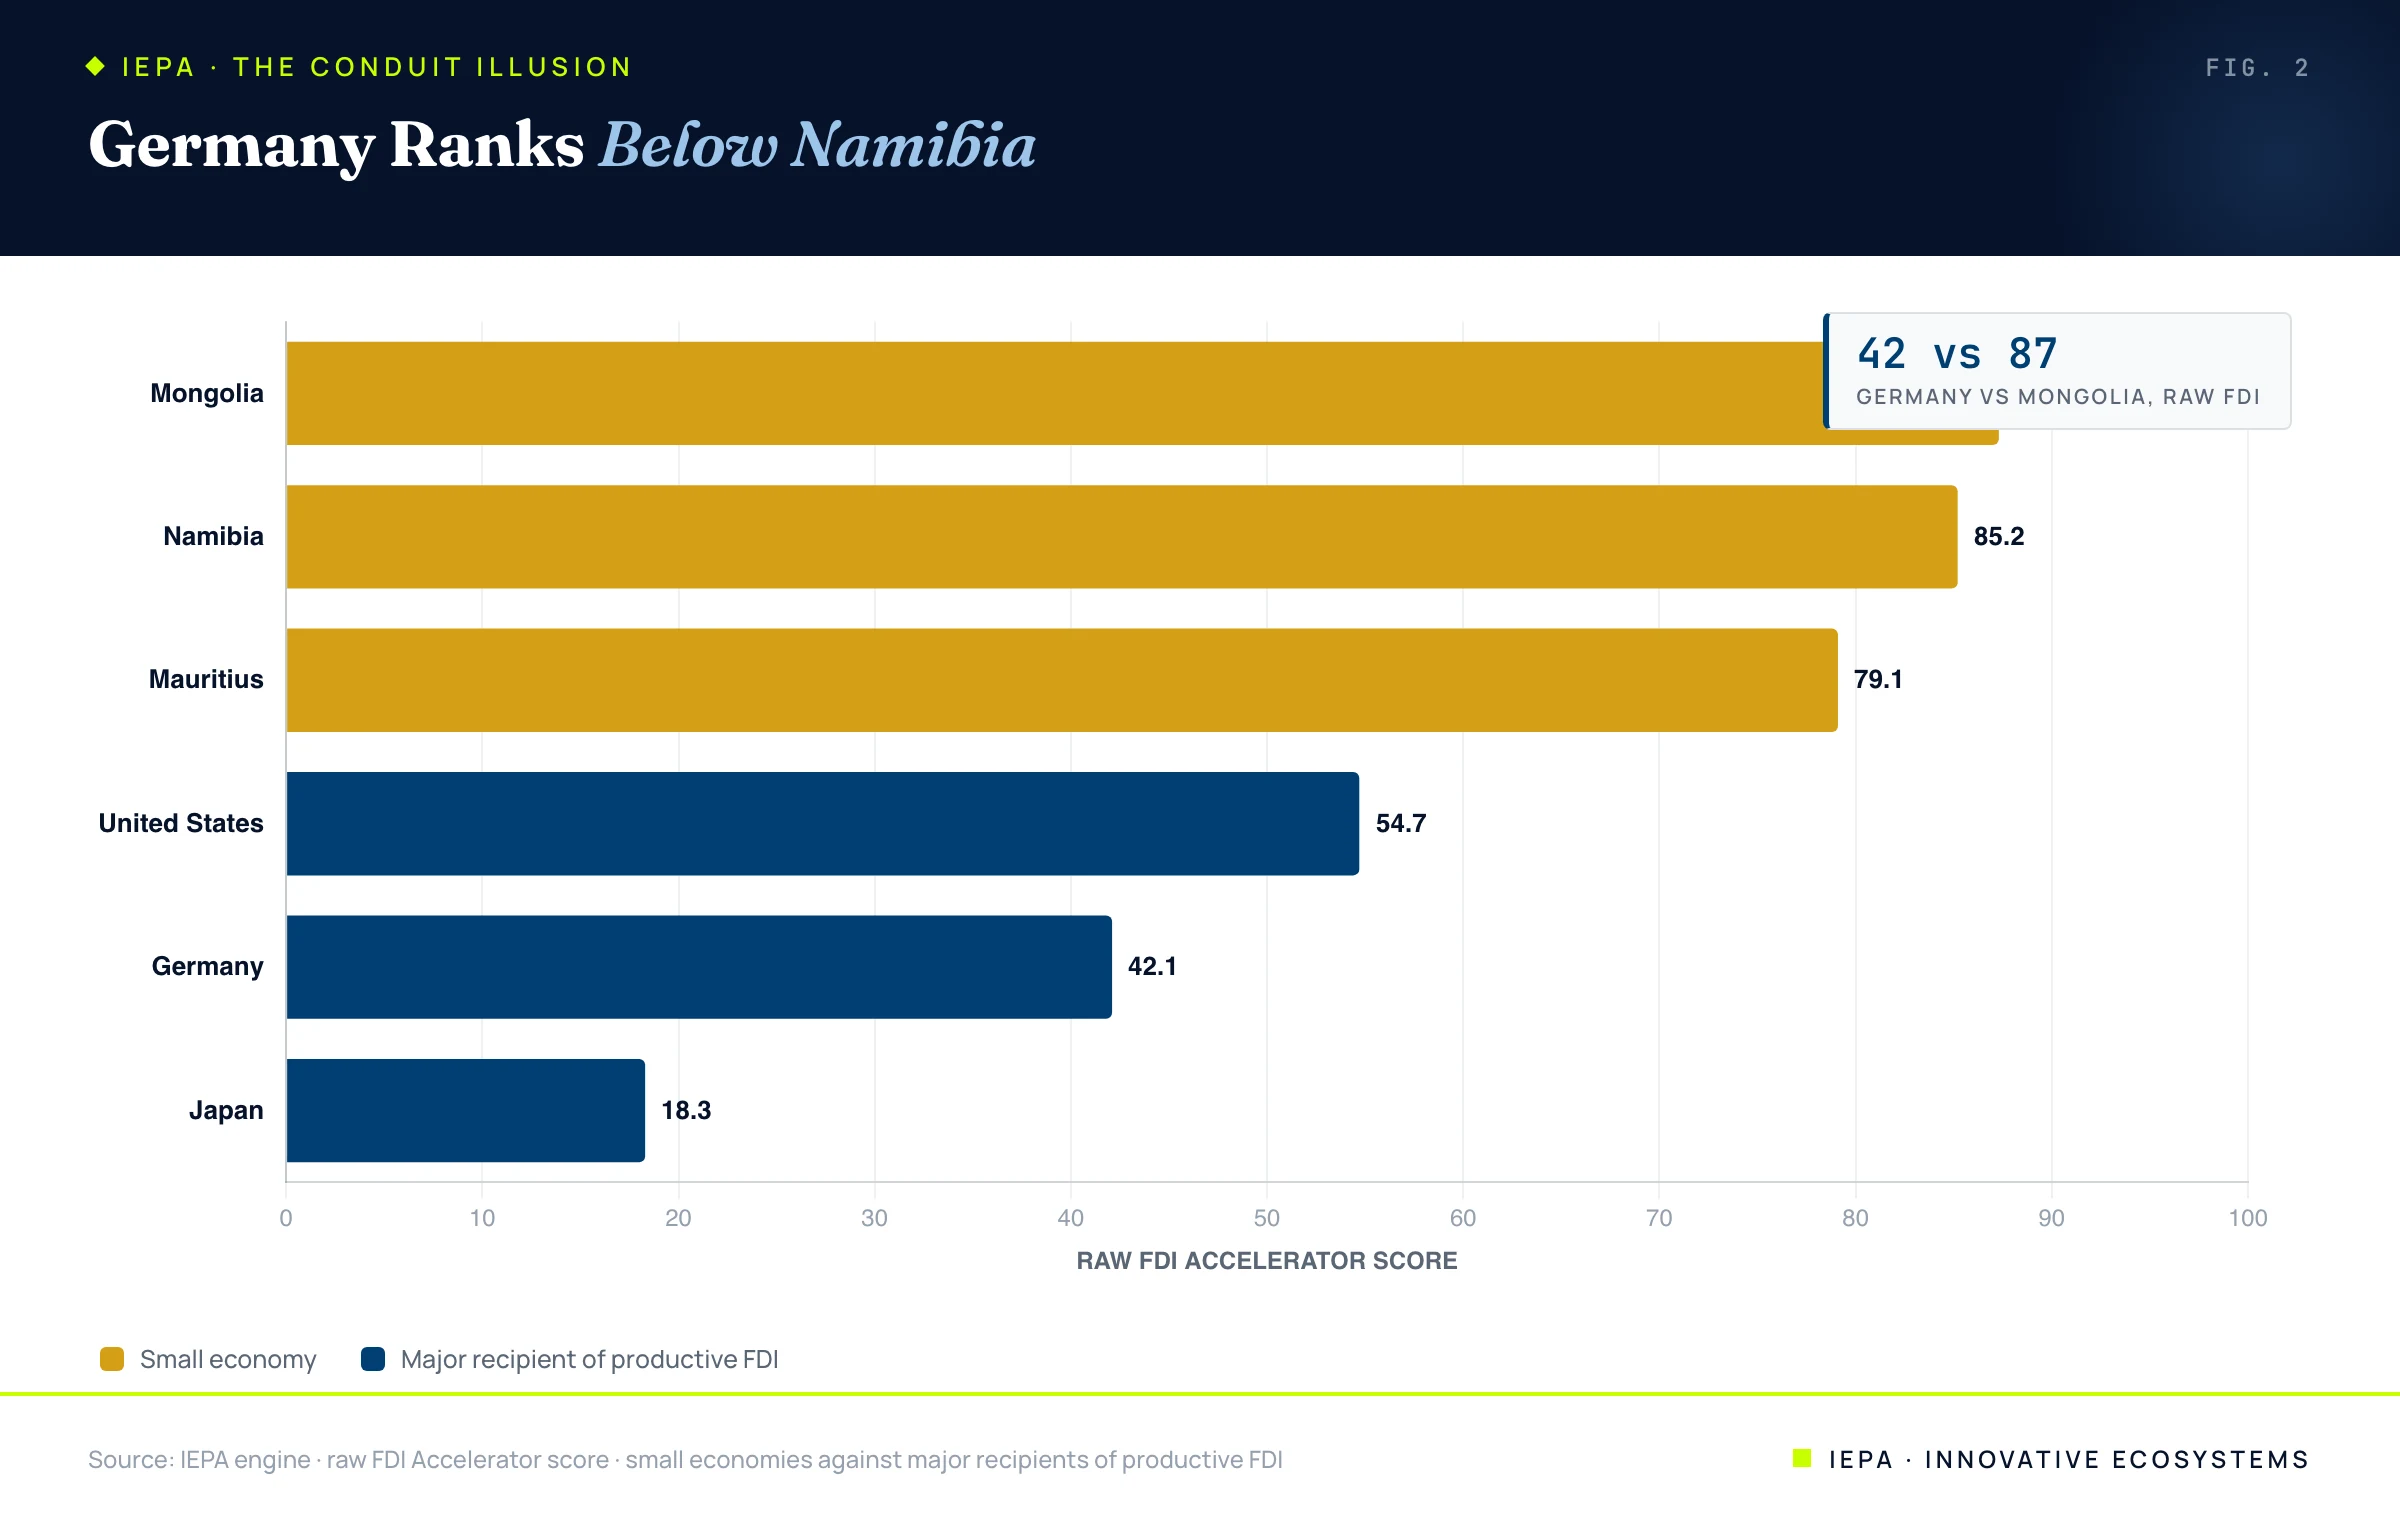
Germany scores 42 on the raw FDI zone. Mongolia scores 87, Namibia 85, Mauritius 79. Taken at face value, the number says Mongolia is roughly twice as attractive to foreign investment as the fourth-largest economy in the world, and that Namibia and Mauritius comfortably outrank it too. Japan, which receives some of the largest greenfield investments on the planet, scores 18, near the very bottom. No one who has looked at a map of where capital actually builds things believes this ranking, and a serious index cannot publish it as though they should.
04What We Do Instead: Curate in the Open
The temptation is to quietly delete the offending economies, or to invent an adjustment that pushes the familiar names back to the top. We do neither, because both are their own kind of lie. Instead we curate, transparently, and the discipline has three parts.
First, every economy stays fully scored and fully visible. Hong Kong, Mongolia, and Namibia keep their real FDI numbers; nothing is deleted. Second, headline surfaces show the tiers we can stand behind. Our curated leaderboards filter to the benchmark and tiered economies that are scored on enough deep, reliable data to compare without caveat, and the conduit-distorted economies sit behind explicit tier and confidence filters, where a reader who wants them can find them with the distortion clearly marked. Third, the confidence band tells the truth about the score. A conduit's FDI figure ships with the same coverage-aware confidence value as everything else, so the reader can see exactly how much weight it deserves.
The result is an index that shows both readings and never pretends the raw one is the real one. The curated board answers the question a region or an investor actually asks, where does productive capital build, while the full field remains available for anyone who wants to study the conduits themselves.
05Why the Illusion Is a Trust Test
It would be easy to treat all of this as a technical footnote. It is not. How an index handles the conduit illusion is the clearest single signal of whether it can be trusted on anything else, because it is the one place where the easy, impressive-looking number and the honest, defensible number openly diverge. An index that publishes the raw FDI leaderboard because Hong Kong and Mongolia at the top look authoritative has revealed that it will choose the impressive number over the true one whenever the two part ways. And they part ways constantly, in every zone, on every economy.
We built the IEPA so that the public-facing number is always the one we can defend, which in the FDI zone means curated, confidence-banded, and honest about the distortion. The conduit illusion is where most indices quietly fail that test. Handling it in the open, rather than letting the math lie, is not a caveat buried in a methodology note. It is the whole reason an index deserves to be read at all.
All economy-level FDI Accelerator scores and the curated tiers are computed from the live IEPA engine across 117 economies. The phantom-FDI estimate and external references are listed below.
- Damgaard, J., Elkjaer, T., & Johannesen, N. (2019). The Rise of Phantom Investments. IMF Finance & Development.
- UNCTAD (2024). World Investment Report 2024.
- Innovative EcoSystems. The IEPA Index, The FDI Paradox, and The IEPA Methodology (companion papers).
The Accelerator, Not the Engine
FDI pays off only where the foundations already hold. Finland against Cambodia, quantified.
→Explore the IEPA
Six zones, every market this research is scored from.
→Open the Atlas
The live global registry this research is drawn from.
→