The Accelerator, Not the Engine
Foreign investment is the zone every region chases hardest and the one the index predicts least. Capital compounds on a strong foundation and evaporates off a weak one.
The fifth IEPA zone, the FDI Accelerator, measures an economy's capacity to attract and absorb foreign capital relative to the size of its economy. It is the single zone every investment-promotion agency is built to move, and it is weighted as an Engine in the index, a multiplier on the foundations rather than a foundation in its own right. The data says the name is exactly right.
- It is the maverick zone. The FDI Accelerator correlates with the IEPA composite at just 0.60, the loosest of any zone, against 0.82 to 0.89 for the foundations. It is also the most dispersed zone in the index. Foreign capital behaves less like a capability an economy holds than like weather it catches.
- The accelerator needs something to accelerate. Split the field by the strength of its foundations and the payoff to FDI is conditional. On a strong foundation, more capital buys a few points of prosperity. On a weak one it buys nothing at all: the high-FDI half averages slightly lower than the low-FDI half, and the correlation collapses to 0.03.
- The foundation, not the flow, sets the level. The prosperity gap between strong and weak foundations is roughly +17 points and swamps anything FDI adds within either band. Capital is leverage on the base, not a substitute for it.
- Cambodia proves the point in reverse. It attracts more foreign investment than Finland, relative to size, and lands 19 points lower on the composite, because that capital arrives on a foundation of 35 against Finland's 79. The accelerator is not the engine.
No zone in the index is competed for as hard as this one. Investment-promotion agencies, incentive packages, special economic zones, ribbon-cuttings for a marquee plant: the entire apparatus of regional economic strategy is, in practice, organized around a single number, the foreign capital a place can pull in. Which makes the data awkward, because of the six lenses, the FDI Accelerator is the one that tells you the least about how an economy is actually doing. The thing regions chase hardest is the thing the index predicts worst.
01What the Zone Measures
The FDI Accelerator scores how much foreign direct investment an economy attracts and retains, measured relative to the size of that economy so that a small state pulling in capital at scale is not buried under the absolute volumes of a large one. It is the IEPA's Engine zone, weighted at a deliberate 0.20 of the composite, less than the half-weight carried by the four Foundations together. That design choice encodes a thesis we can now test directly: that capital is a force which multiplies what an economy already has, rather than one which originates capability on its own.
The classical literature drew the same line long before we built the index. The first wave of FDI-and-growth studies assumed capital was a more or less universal good; the second wave found that it was not. Eduardo Borensztein, Jose De Gregorio, and Jong-Wha Lee showed that the productivity gain from foreign investment only materializes above a threshold of local human capital. Laura Alfaro and colleagues found a parallel conditionality in financial markets: FDI raises growth meaningfully only where the local financial system is developed enough to put it to work. In both cases the finding was the same. Capital is not the active ingredient. The base it lands on is.
02The Maverick Zone
Start with how the zone sits inside the index. Every other zone, foundation or outcome, moves more or less together: an economy strong in one tends to be strong in the rest, which is why each correlates with the composite in the high eighties. The FDI Accelerator does not keep that company.
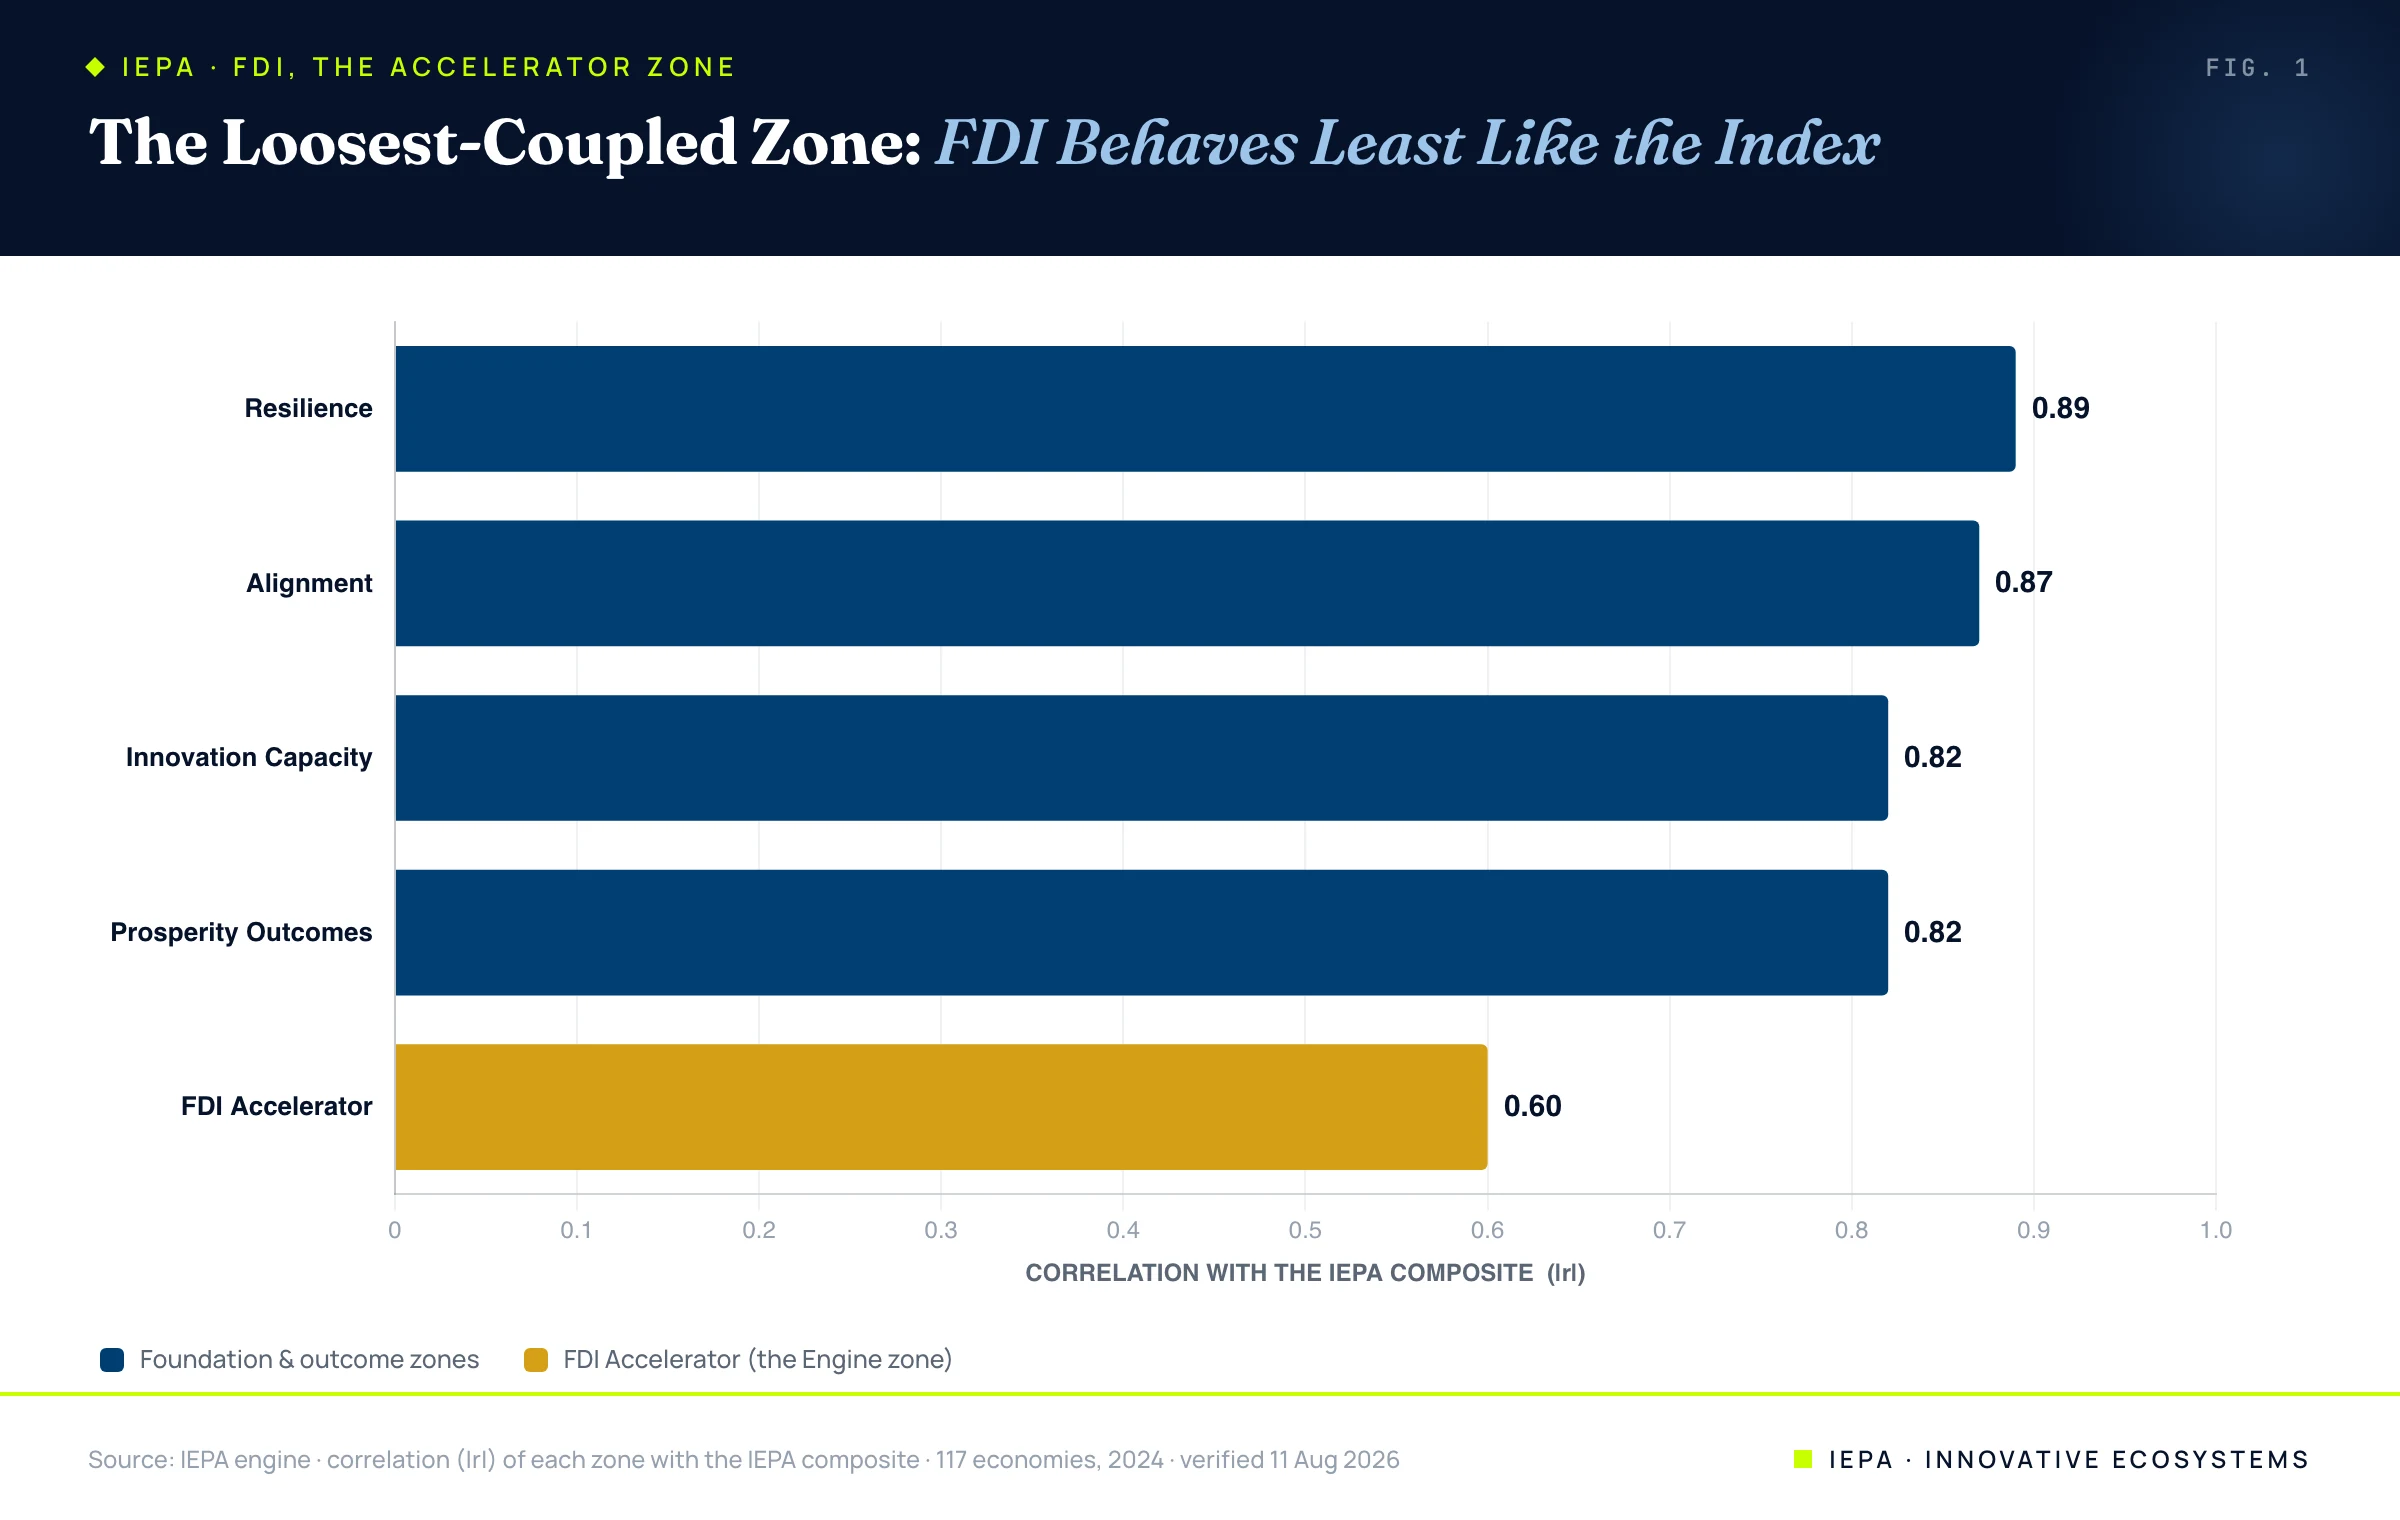
At 0.60, foreign investment is the only zone that routinely diverges from the rest of an economy's profile, and its links to the individual capabilities are weaker still: it correlates with innovation at just 0.20, the result we have documented elsewhere as the FDI Paradox, and with the alignment and resilience foundations only at 0.38 and 0.40. It is also the most volatile zone, the one with the widest dispersion across the field, because foreign capital responds to resource discoveries, tax structures, and single mega-deals that have little to do with the underlying economy. Some of that spread is genuine and some is the conduit distortion we have treated separately; the curated tiers used here filter the worst of the phantom flows, and what remains is structural. A high FDI score, more than any other, can sit on top of an economy that is otherwise unremarkable. That looseness is not noise to be cleaned away. It is the zone telling you what it is: not a measure of what an economy can do, but of what is currently flowing toward it.
03The Accelerator Needs Something to Accelerate
If capital were an engine, it would produce prosperity wherever it landed. If it is an accelerator, it should produce prosperity only where there is a foundation underneath to multiply. The index lets us test the difference directly, by splitting the field on the strength of its foundations and asking what foreign investment does inside each half.
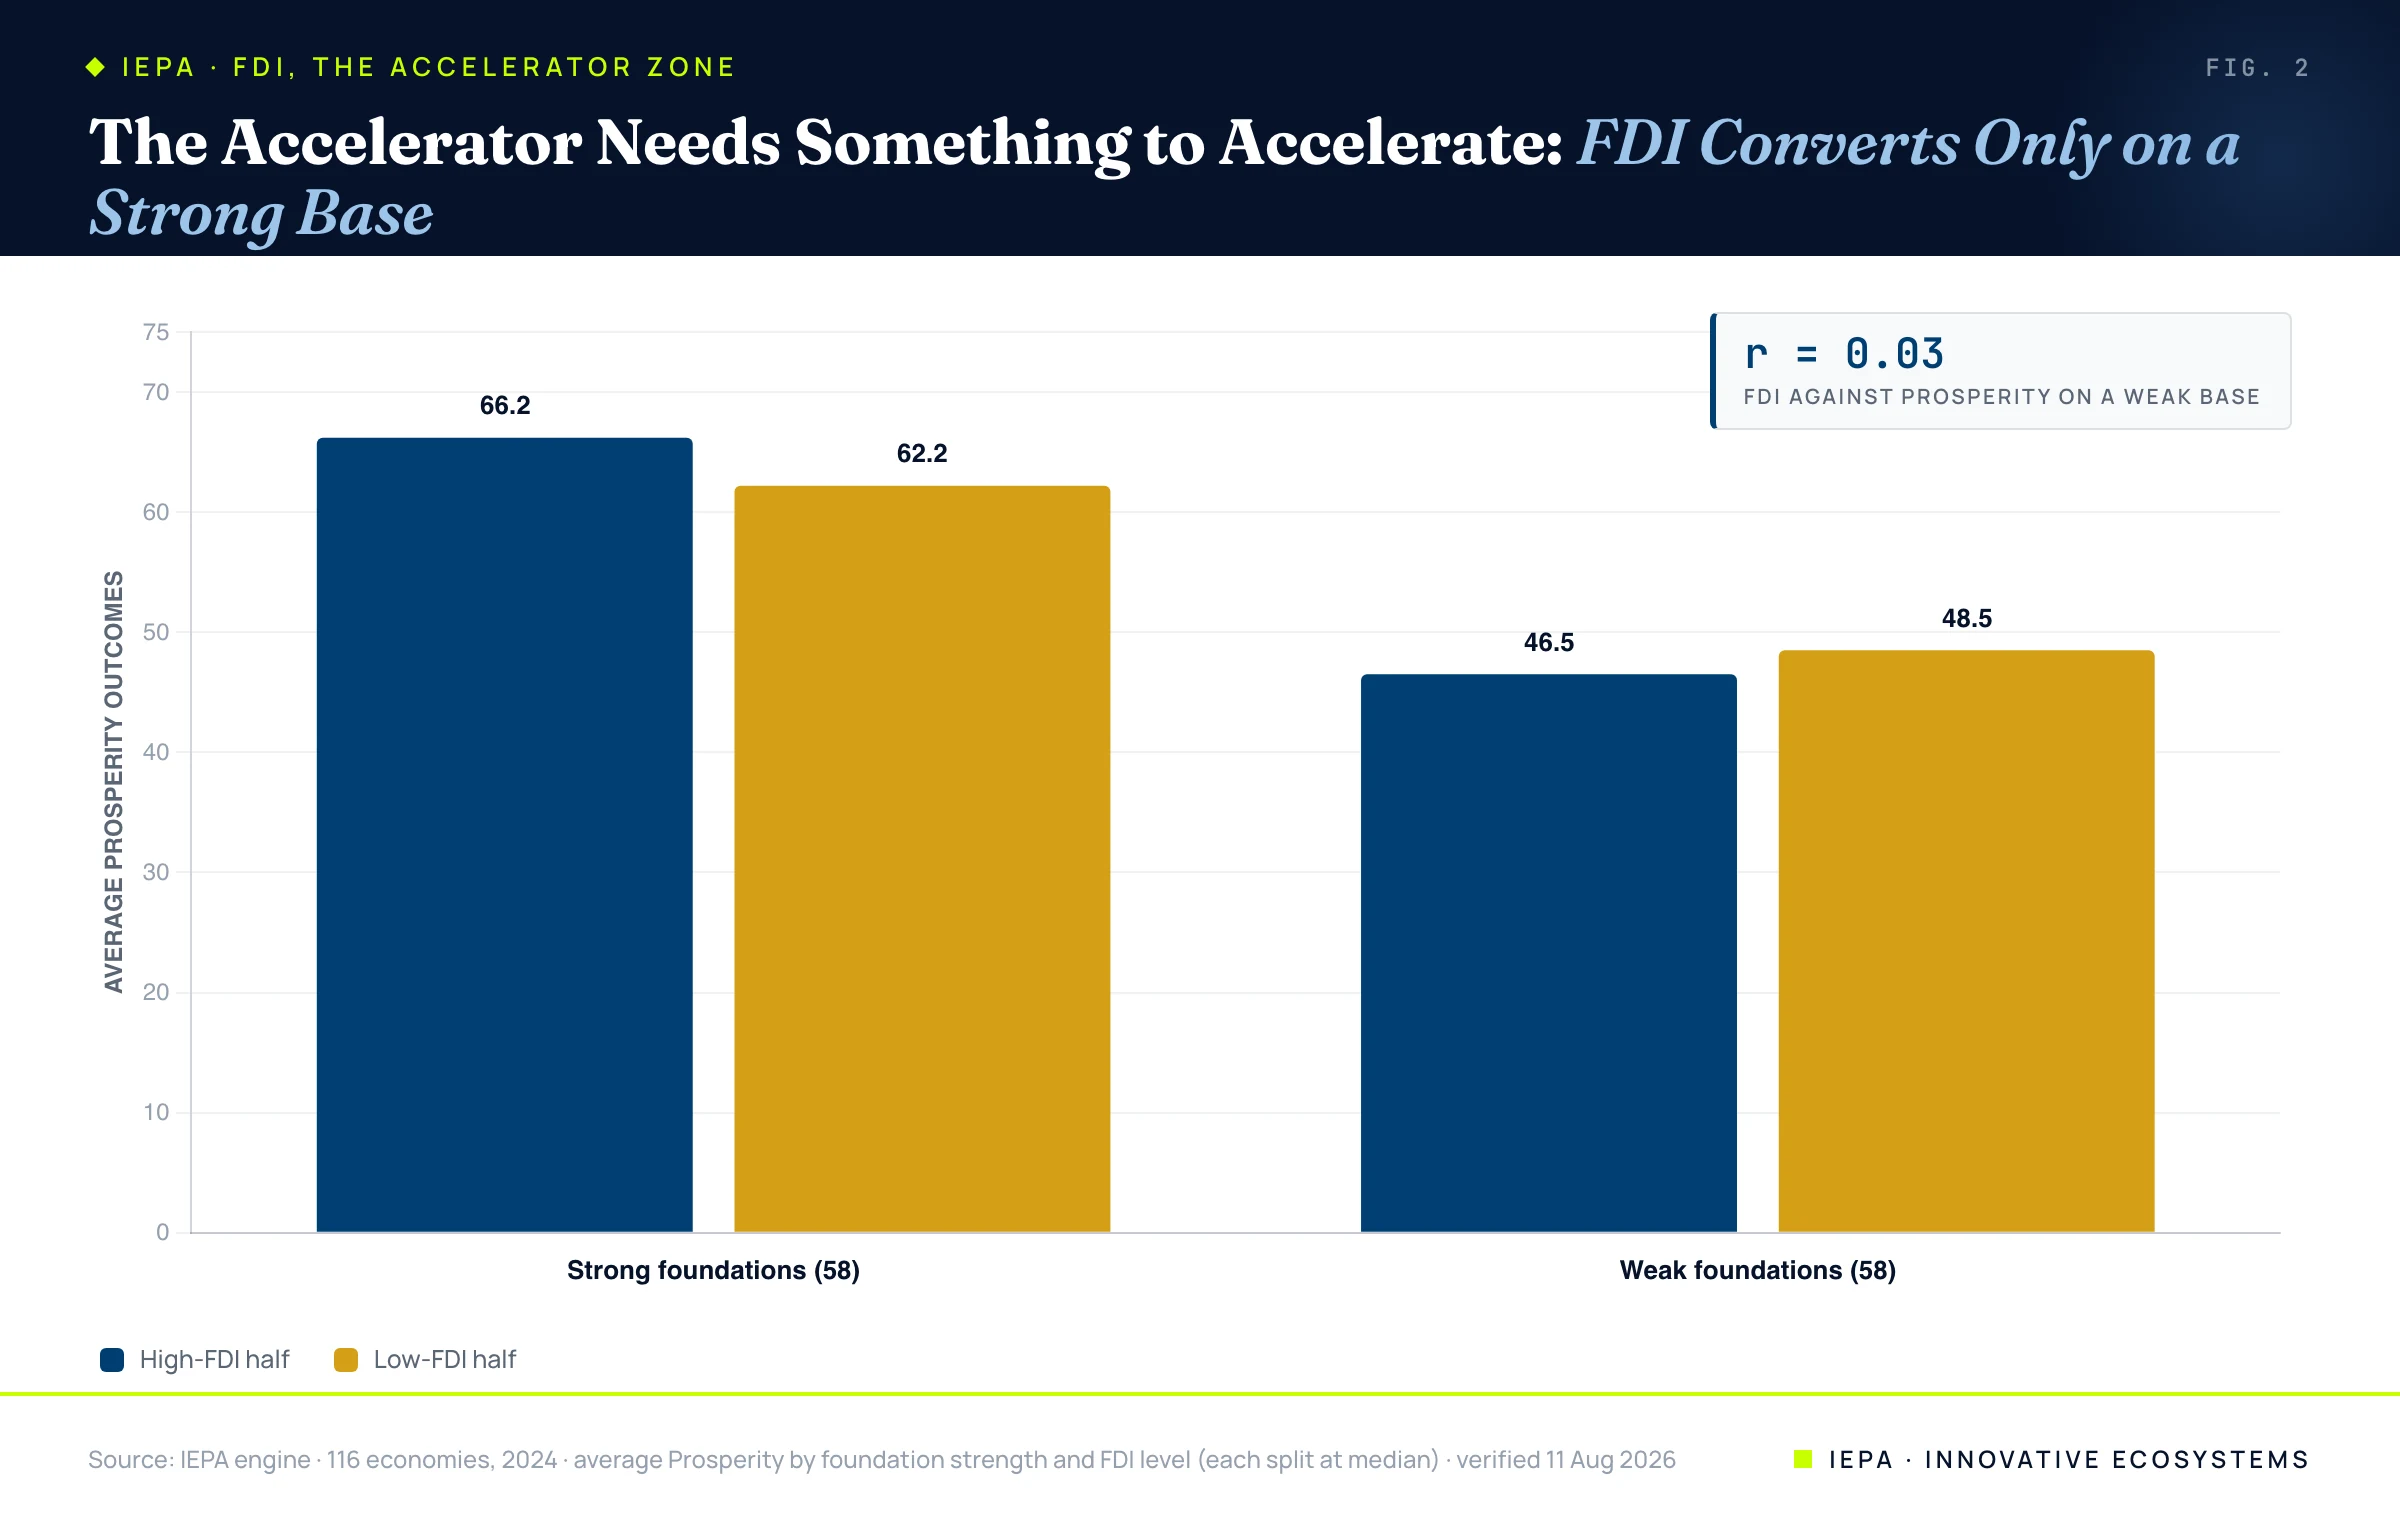
The reading is stark. Where the foundations are strong, foreign investment adds something real but modest: a few points of prosperity, an accelerant on an economy already moving. Where the foundations are weak, it adds nothing at all. The high-FDI half of that group averages 46.5 against the low-FDI half's 48.5, a difference in the wrong direction and comfortably inside noise, and the underlying correlation is 0.03. This is Borensztein and Alfaro's conditionality, recovered from a different dataset two decades on: capital is not a cause of prosperity so much as a lever on it, and a lever with no fulcrum moves nothing. The foundation does the work. The flow only amplifies what the foundation has already built.
| Economy (2024) | FDI Accel. | Foundations | Prosperity | Composite |
|---|---|---|---|---|
| Singapore | 83 | 76 | 87 | 80 |
| UAE | 76 | 59 | 85 | 70 |
| Cambodia | 76 | 35 | 61 | 51 |
| Vietnam | 68 | 48 | 66 | 58 |
| Finland | 62 | 79 | 61 | 70 |
| Egypt | 51 | 38 | 39 | 41 |
| United States | 39 | 76 | 72 | 68 |
The United Arab Emirates and Cambodia are the matched pair, and the match is exact: both score 76 on the accelerator, the identical reading on the one zone every promotion agency is built to move. The UAE's lands on a foundation of 59 and compounds into a prosperity of 85. Cambodia's lands on a 35 and reaches 61. The same fuel, two different engines, and only one of them turns. Capital arrived in both places. It only built something in one.
04Cambodia and Finland
The cleanest proof is the case that looks backwards. Cambodia posts an FDI Accelerator of 76, inside the top quintile of the entire zone, higher than Finland, higher than Vietnam, and nearly double the United States. By the logic that organizes most regional strategy, it should be pulling away. Instead it carries a composite of 51, because that capital arrives on a foundation of 35 and finds little to multiply. Finland is the mirror image: it attracts materially less foreign investment, 62 against Cambodia's 76, and carries a composite of 70, because its foundations score 79 and it simply does not need much foreign capital to compound a prosperous, resilient economy.
Put the two side by side and the zone's whole character resolves. More foreign investment did not make Cambodia more prosperous than Finland; less of it did not stop Finland from finishing 19 points ahead. The variable that everyone optimizes turns out to be the one that, on its own, decides the least. That is not an argument against foreign capital. It is an argument about what foreign capital is for: it is the accelerator, and an accelerator only matters once there is an engine for it to drive.
Capital is the lever, not the fulcrum. A lever with nothing under it moves nothing, however hard the region pulls.
05The Builder's Reading
For a region, this inverts the default playbook in a useful way. The instinct is to lead with the accelerator, to win the marquee plant or the headline fund first and trust that prosperity follows the money in. The data says the money does not carry prosperity on its own; it carries the multiple. A foreign investment won onto a thin foundation lands extractive and transient, a flow that passes through without compounding, exactly the pattern of capital that arrives for a resource and leaves with it. The same investment won onto a strong foundation becomes an anchor that builds an ecosystem around itself.
So the sequence that matters is the unglamorous one. Build the foundations first, the institutions and capabilities that give capital something to multiply, and the FDI Accelerator stops being a target to chase and becomes the return on everything underneath it. The goal is not to maximize the inflow. It is to be the kind of economy where an inflow compounds, so that the capital a region does attract stays, deepens, and pays off. Of the six lenses, the FDI Accelerator is the one most mistaken for the engine. It is the most visible zone and the most chased, and on this evidence it is the one that originates the least. It moves what the other five have already built, and not a great deal more.
Zone scores, the foundation and FDI median splits, and all correlations are computed on the live IEPA engine across 117 economies for the 2024 assessment year, the headline reference vintage, with later years treated as trend extension. Figures were re-verified on 11 August 2026, following an upstream refresh of the underlying foreign-investment series; the FDI Accelerator moved materially for a number of economies and the figures here reflect the refreshed data. The Foundations score is the mean of the four foundation zones. Scores are normalized 0 to 100. No estimates.
- Alfaro, L., Chanda, A., Kalemli-Ozcan, S., & Sayek, S. (2004). FDI and Economic Growth: The Role of Local Financial Markets. Journal of International Economics, 64(1), 89–112.
- Borensztein, E., De Gregorio, J., & Lee, J.-W. (1998). How Does Foreign Direct Investment Affect Economic Growth? Journal of International Economics, 45(1), 115–135.
- Innovative EcoSystems. The FDI Paradox, and The Conduit Illusion. 2026.
- Innovative EcoSystems. Why We Built Six Zones Instead of One Number. 2026.
- Innovative EcoSystems. The IEPA Index and Methodology. 2026.
Seventy Percent Would Have Come Anyway
Investor surveys put incentive redundancy at 70 to 85 percent. The most common tool in investment promotion is mostly a discount for buyers who had already decided.
→Explore the IEPA
Six zones, every market this research is scored from.
→Open the Atlas
The live global registry this research is drawn from.
→