The Comeback Belt
A band of economies is converging upward. What is driving it, whether it will last, and why it points at Italy.
Spread across two arcs, Southern Europe and the Balkans on one side, the Caucasus and Central Asia on the other, a band of economies has been converging upward faster than anyone else over the past decade. We call it the Comeback Belt, and the IEPA panel lets us do more than name it. It lets us dissect it. Decomposing each comeback zone by zone reveals a consistent and double-edged anatomy. The gains were led by foreign capital and realized prosperity, and lagged, almost completely, by institutional alignment. The belt got richer and more open without getting better governed, which is precisely the condition that catch-up theory, from Gerschenkron to Abramovitz, warns is unstable. The data agrees: Southern Europe's recovery peaked around 2021 and has since softened.
- Convergence is real. A beta-convergence test on the full panel gives a slope of −0.060: economies that started lower gained more. The belt is the leading edge of that catch-up.
- The anatomy is capital-led. Across the eight belt economies, the FDI Accelerator zone rose an average of +20.4 points and Prosperity Outcomes +16.1, while Alignment rose +0.1. Recoveries were funded and realized, not governed.
- Durability is the open question. The missing institutional deepening is Abramovitz's “social capability” gap, and the post-2021 plateau across Southern Europe is what its absence looks like.
- Italy is the thesis in one country. Innovation 71 and Alignment 71, but FDI 35 and Prosperity 55: a high-capability, well-governed economy with a textbook conversion gap, the clearest single illustration of the one thing the belt proves can be engineered.
01The Belt
Eight of the fastest-rising economies in the IEPA panel over 2015 to 2024 do not scatter randomly across the map. They concentrate in two recognizable arcs. The first is Southern Europe and the Western Balkans: Croatia (+13.2), Portugal (+11.8), Greece (+11.2), and Serbia (+10.7), the European periphery climbing out of its lost decade. The second is the Caucasus and Central Asia: Armenia (+13.2), Georgia (+9.2), and Mongolia (+16.1, the single largest riser in the field), post-Soviet economies opening to trade and capital. West Africa's Senegal (+11.6) rounds out the belt. That second arc is still moving: in mid-2026 Kazakhstan secured roughly ten billion dollars of AI infrastructure with Nvidia and Firebird, the kind of capital-led opening that drove the belt's first decade, and exactly the kind whose durability the rest of this analysis puts in question.
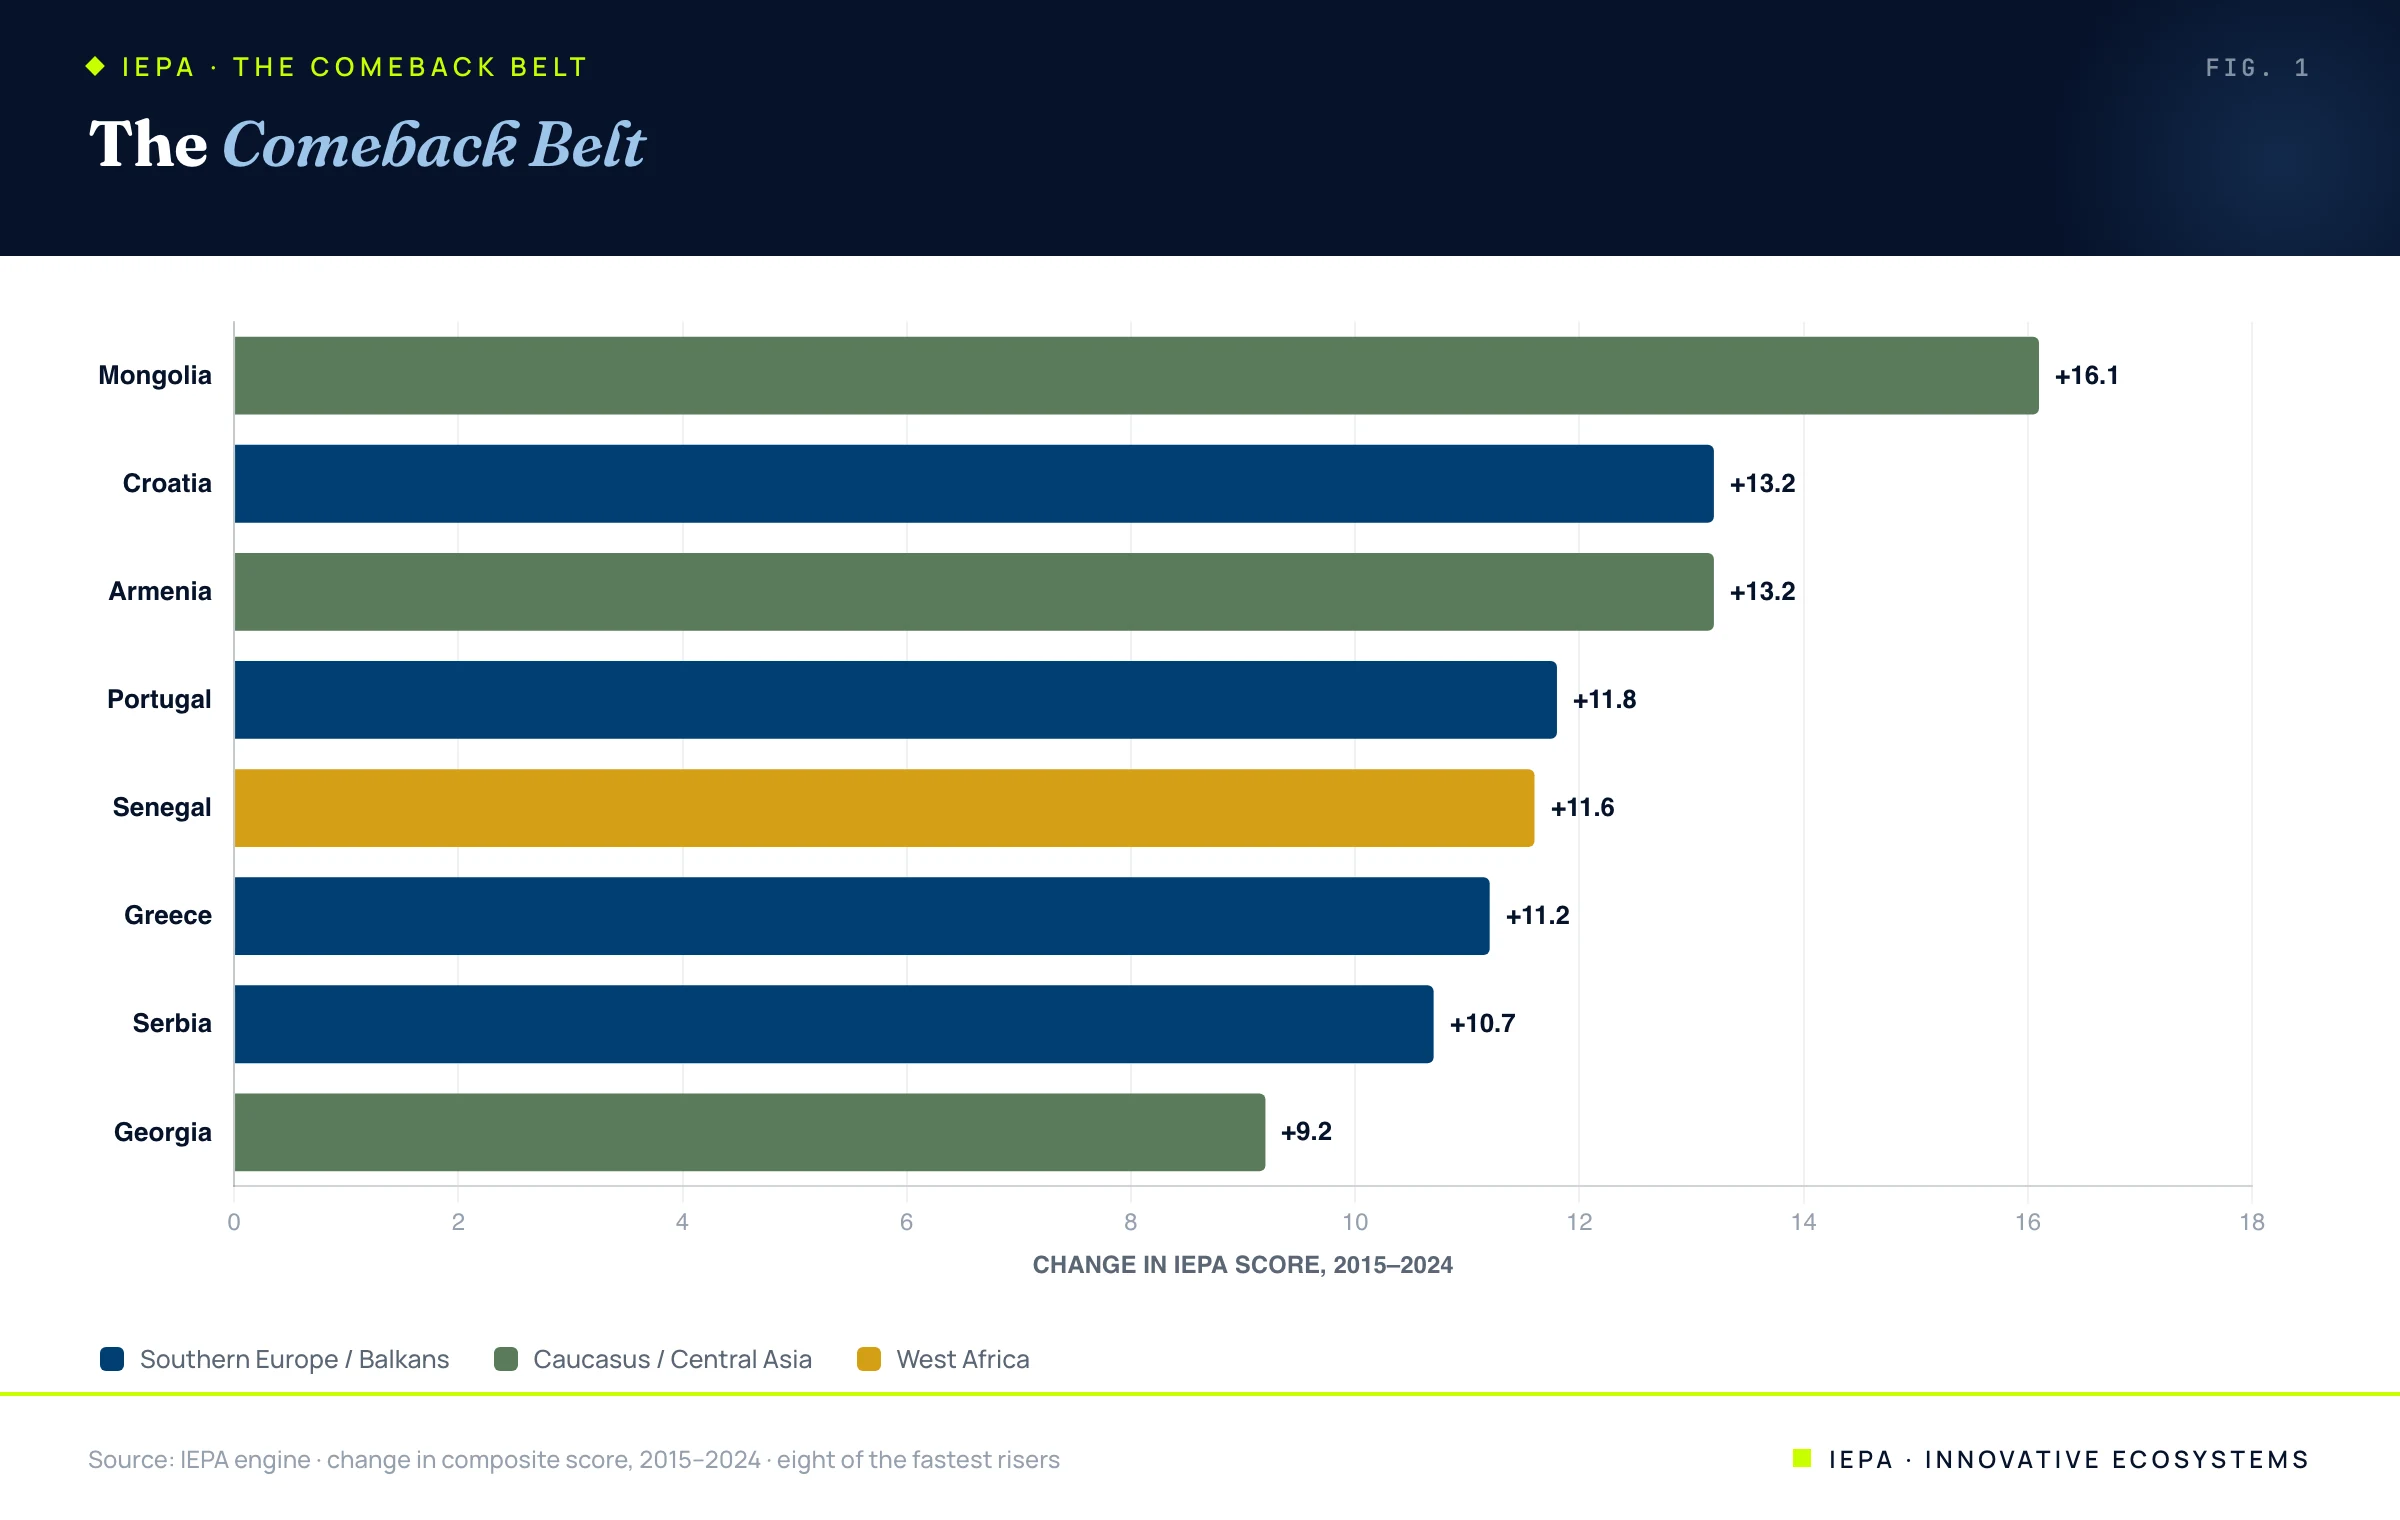
These are not the world's leaders; most still sit in the middle of the global distribution. They are its fastest movers, and where a region is moving is often more informative than where it stands.
02The Theory: Advantages of Backwardness
That laggards can rise fast is one of the oldest ideas in development economics, and one of the most contested. In Gerschenkron's classic account, backwardness carries its own advantages: a late developer can borrow the frontier's technology and, crucially, can substitute new institutional arrangements, state banks, development vehicles, concentrated capital, for the market depth it does not yet have. The idea has a precise empirical form, beta-convergence, the tendency of poorer economies to grow faster than richer ones, and our panel shows it plainly.
But convergence is not automatic, and this is the hinge of the whole story. The potential for catch-up is only realized where an economy possesses what Moses Abramovitz called social capability: the institutions, governance, and absorptive capacity to put borrowed technology and incoming capital to productive use. Backwardness is an opportunity only for those equipped to seize it. The question for the Comeback Belt is therefore not whether it has risen, but whether it has built the social capability to keep rising. The zone-level data answers it, and the answer is uncomfortable.
03The Anatomy of a Comeback
A rising composite can be built from any combination of its parts. So we decomposed each of the eight comebacks into its six zones and averaged the gains across the belt. The result is strikingly lopsided.
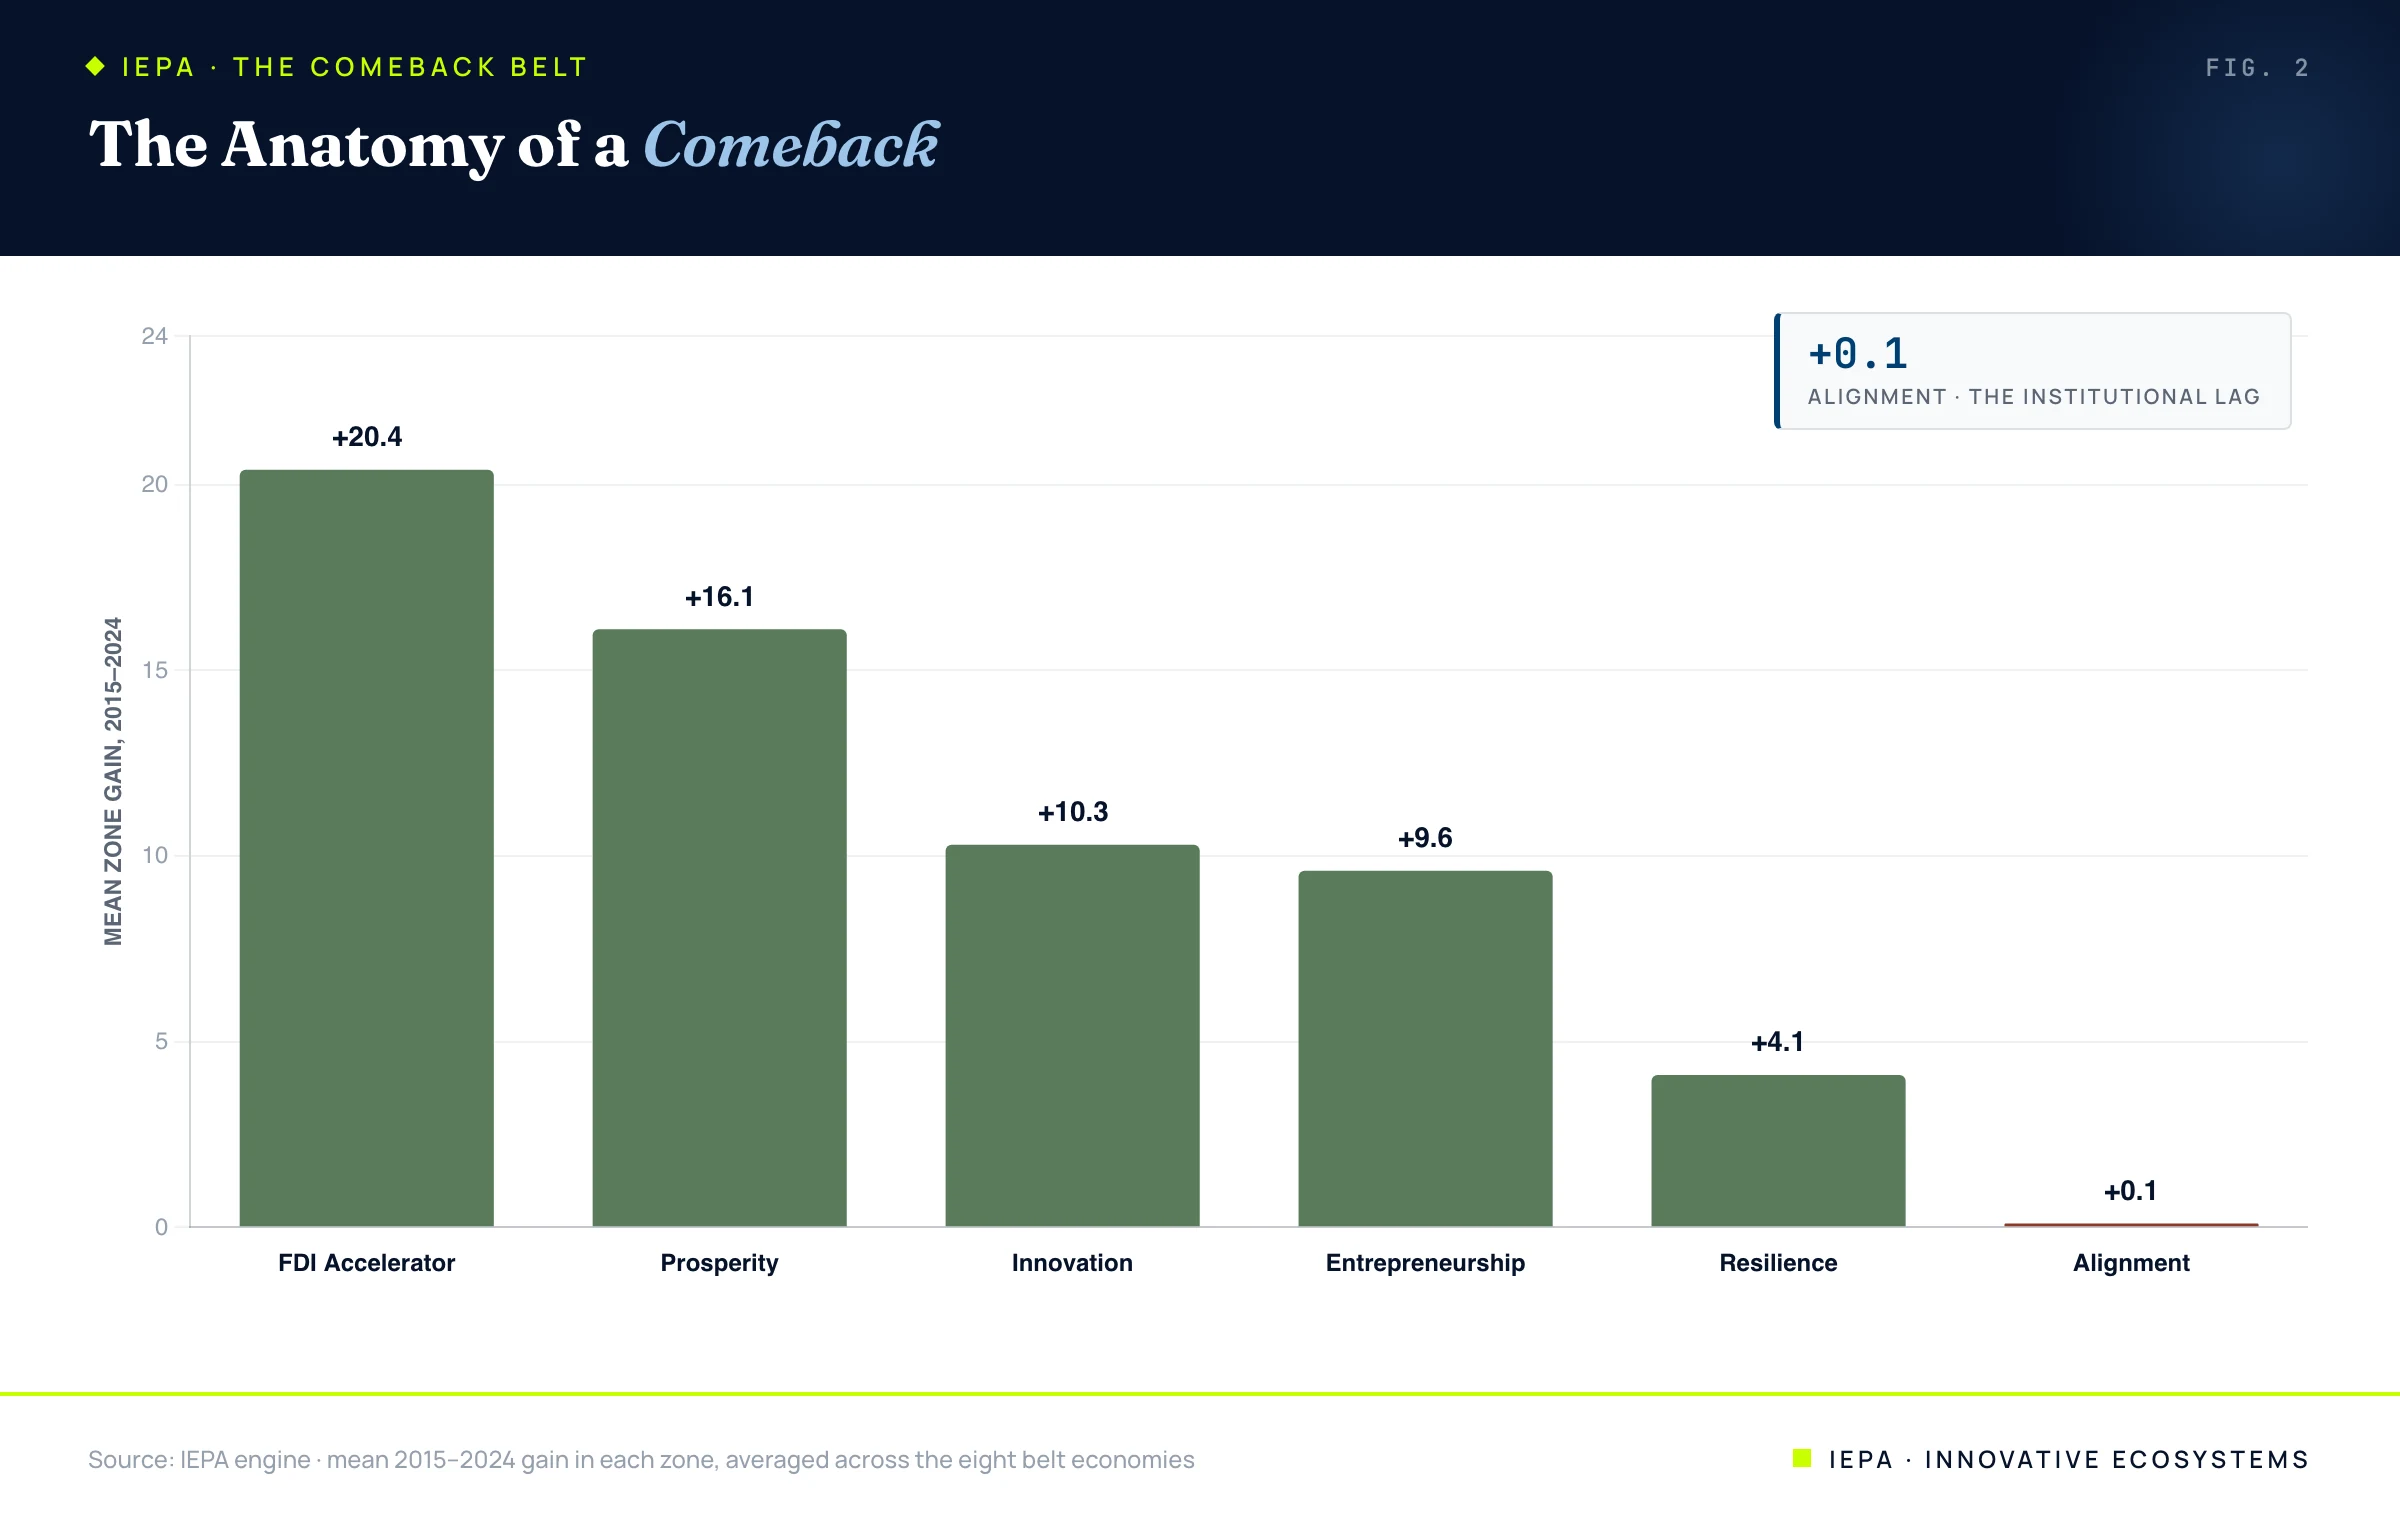
The comebacks were, above all, capital events. The FDI Accelerator zone rose an average of 20.4 points across the belt, more than any other, as nearshoring, EU integration, and post-crisis repricing pulled foreign investment back into the European periphery and out toward the Caucasus. Realized Prosperity followed at +16.1. Innovation and entrepreneurship rose respectably. And then, at the bottom, Alignment: the zone that measures institutional coherence and the rule-of-law foundations of governance gained, on average, one tenth of one point. Several of the belt's stars actually went backward on it: Portugal −3.0, Georgia −3.3, Serbia −1.8.
The belt got richer and more open without getting better governed. That is exactly the kind of catch-up the theory says will not last.
04The Durability Question
Read through Abramovitz, the flat Alignment line is not a footnote; it is the central risk. Capital and prosperity can be imported. Social capability, the institutional machinery that converts a boom into a durable trajectory, has to be built, and the belt has not been building it. The growth-slowdown literature predicts what happens next: fast-growing economies decelerate sharply as they approach the frontier, particularly where institutional quality has not kept pace. This is the empirical core of the middle-income trap, the point at which a catch-up economy that has not built its institutions runs out of road.
The IEPA time series shows the deceleration arriving on schedule. Tracking Southern Europe year by year, the recovery was steep through 2021 and has stalled or reversed since.
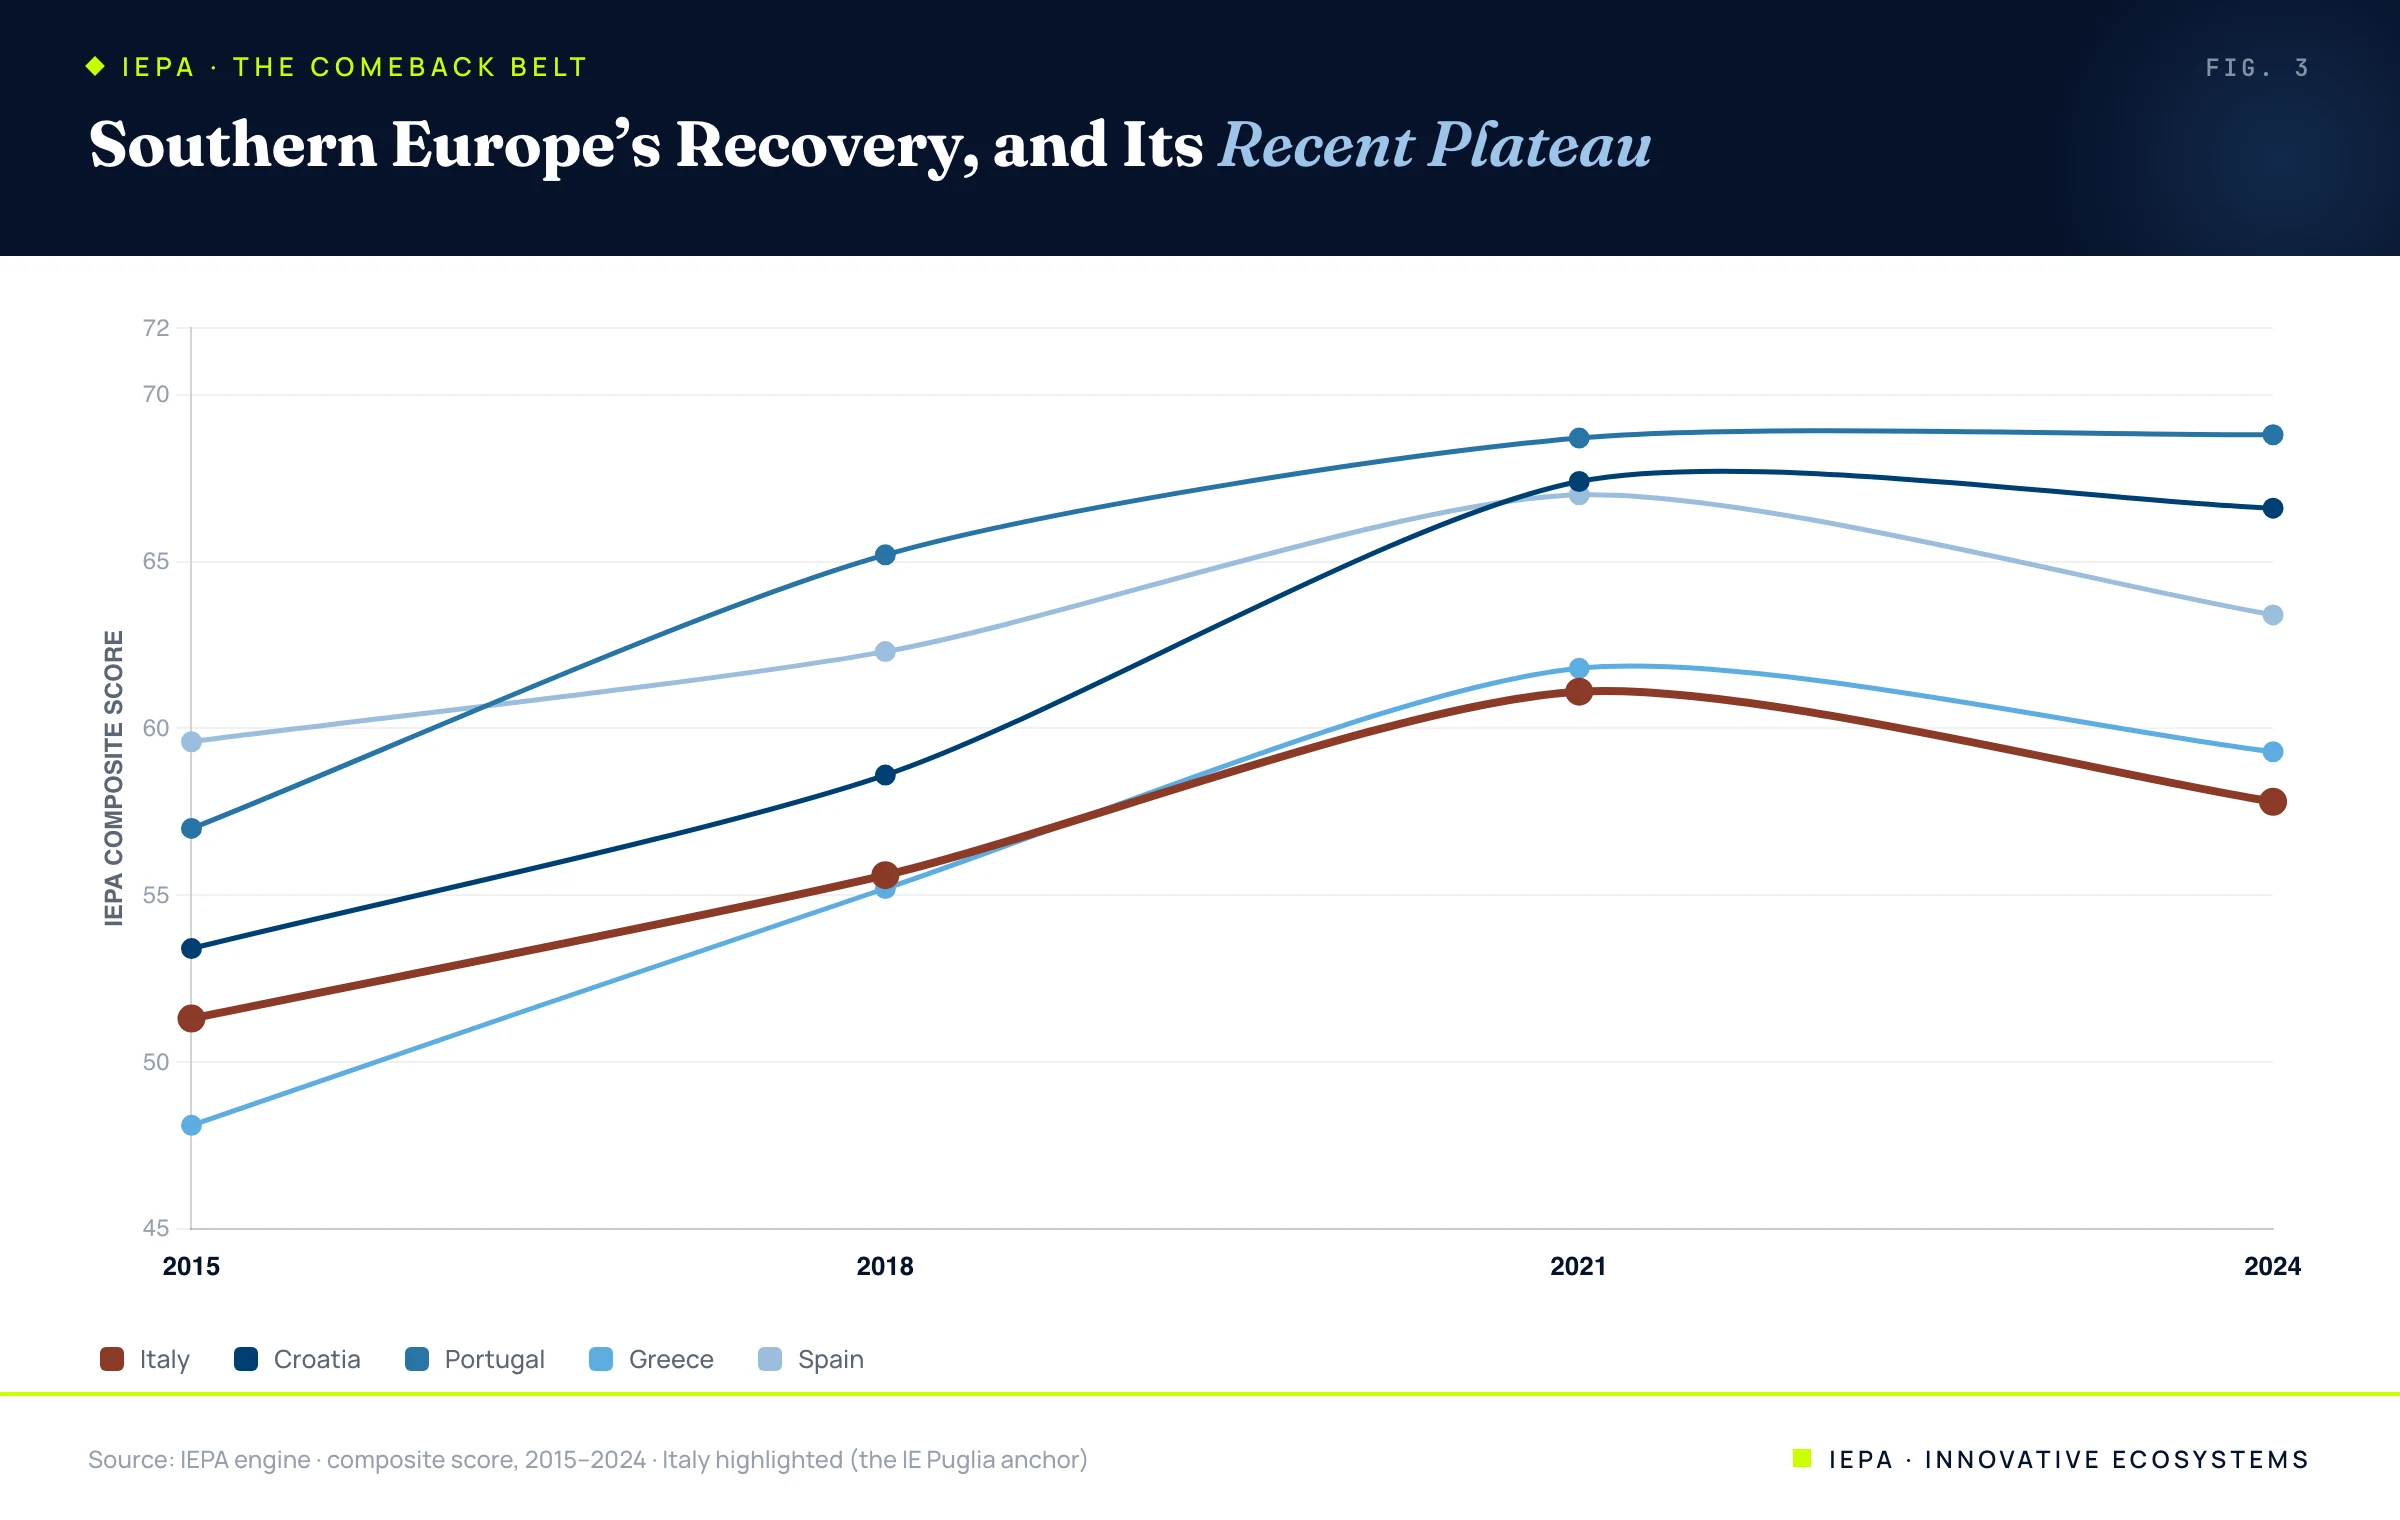
Every one of the five Southern European economies peaked around 2021 and softened afterward: Italy fell from 61.1 to 57.8, Spain from 67.0 to 63.4, Greece from 61.8 to 59.3. The recoveries were real, and they are not over, but they have run into the ceiling that an under-built institutional base imposes. The belt has demonstrated it can catch up. It has not yet demonstrated it can hold.
05Italy, the Conversion Case
One economy in the belt states the opportunity with unusual clarity. Italy scores 71 on Innovation and 71 on Alignment, frontier-grade capability and institutions, and yet only 35 on the FDI Accelerator and 55 on Prosperity Outcomes. It is the FDI Paradox made national: a country with the production frontier of a leader and the capital intensity of a laggard.
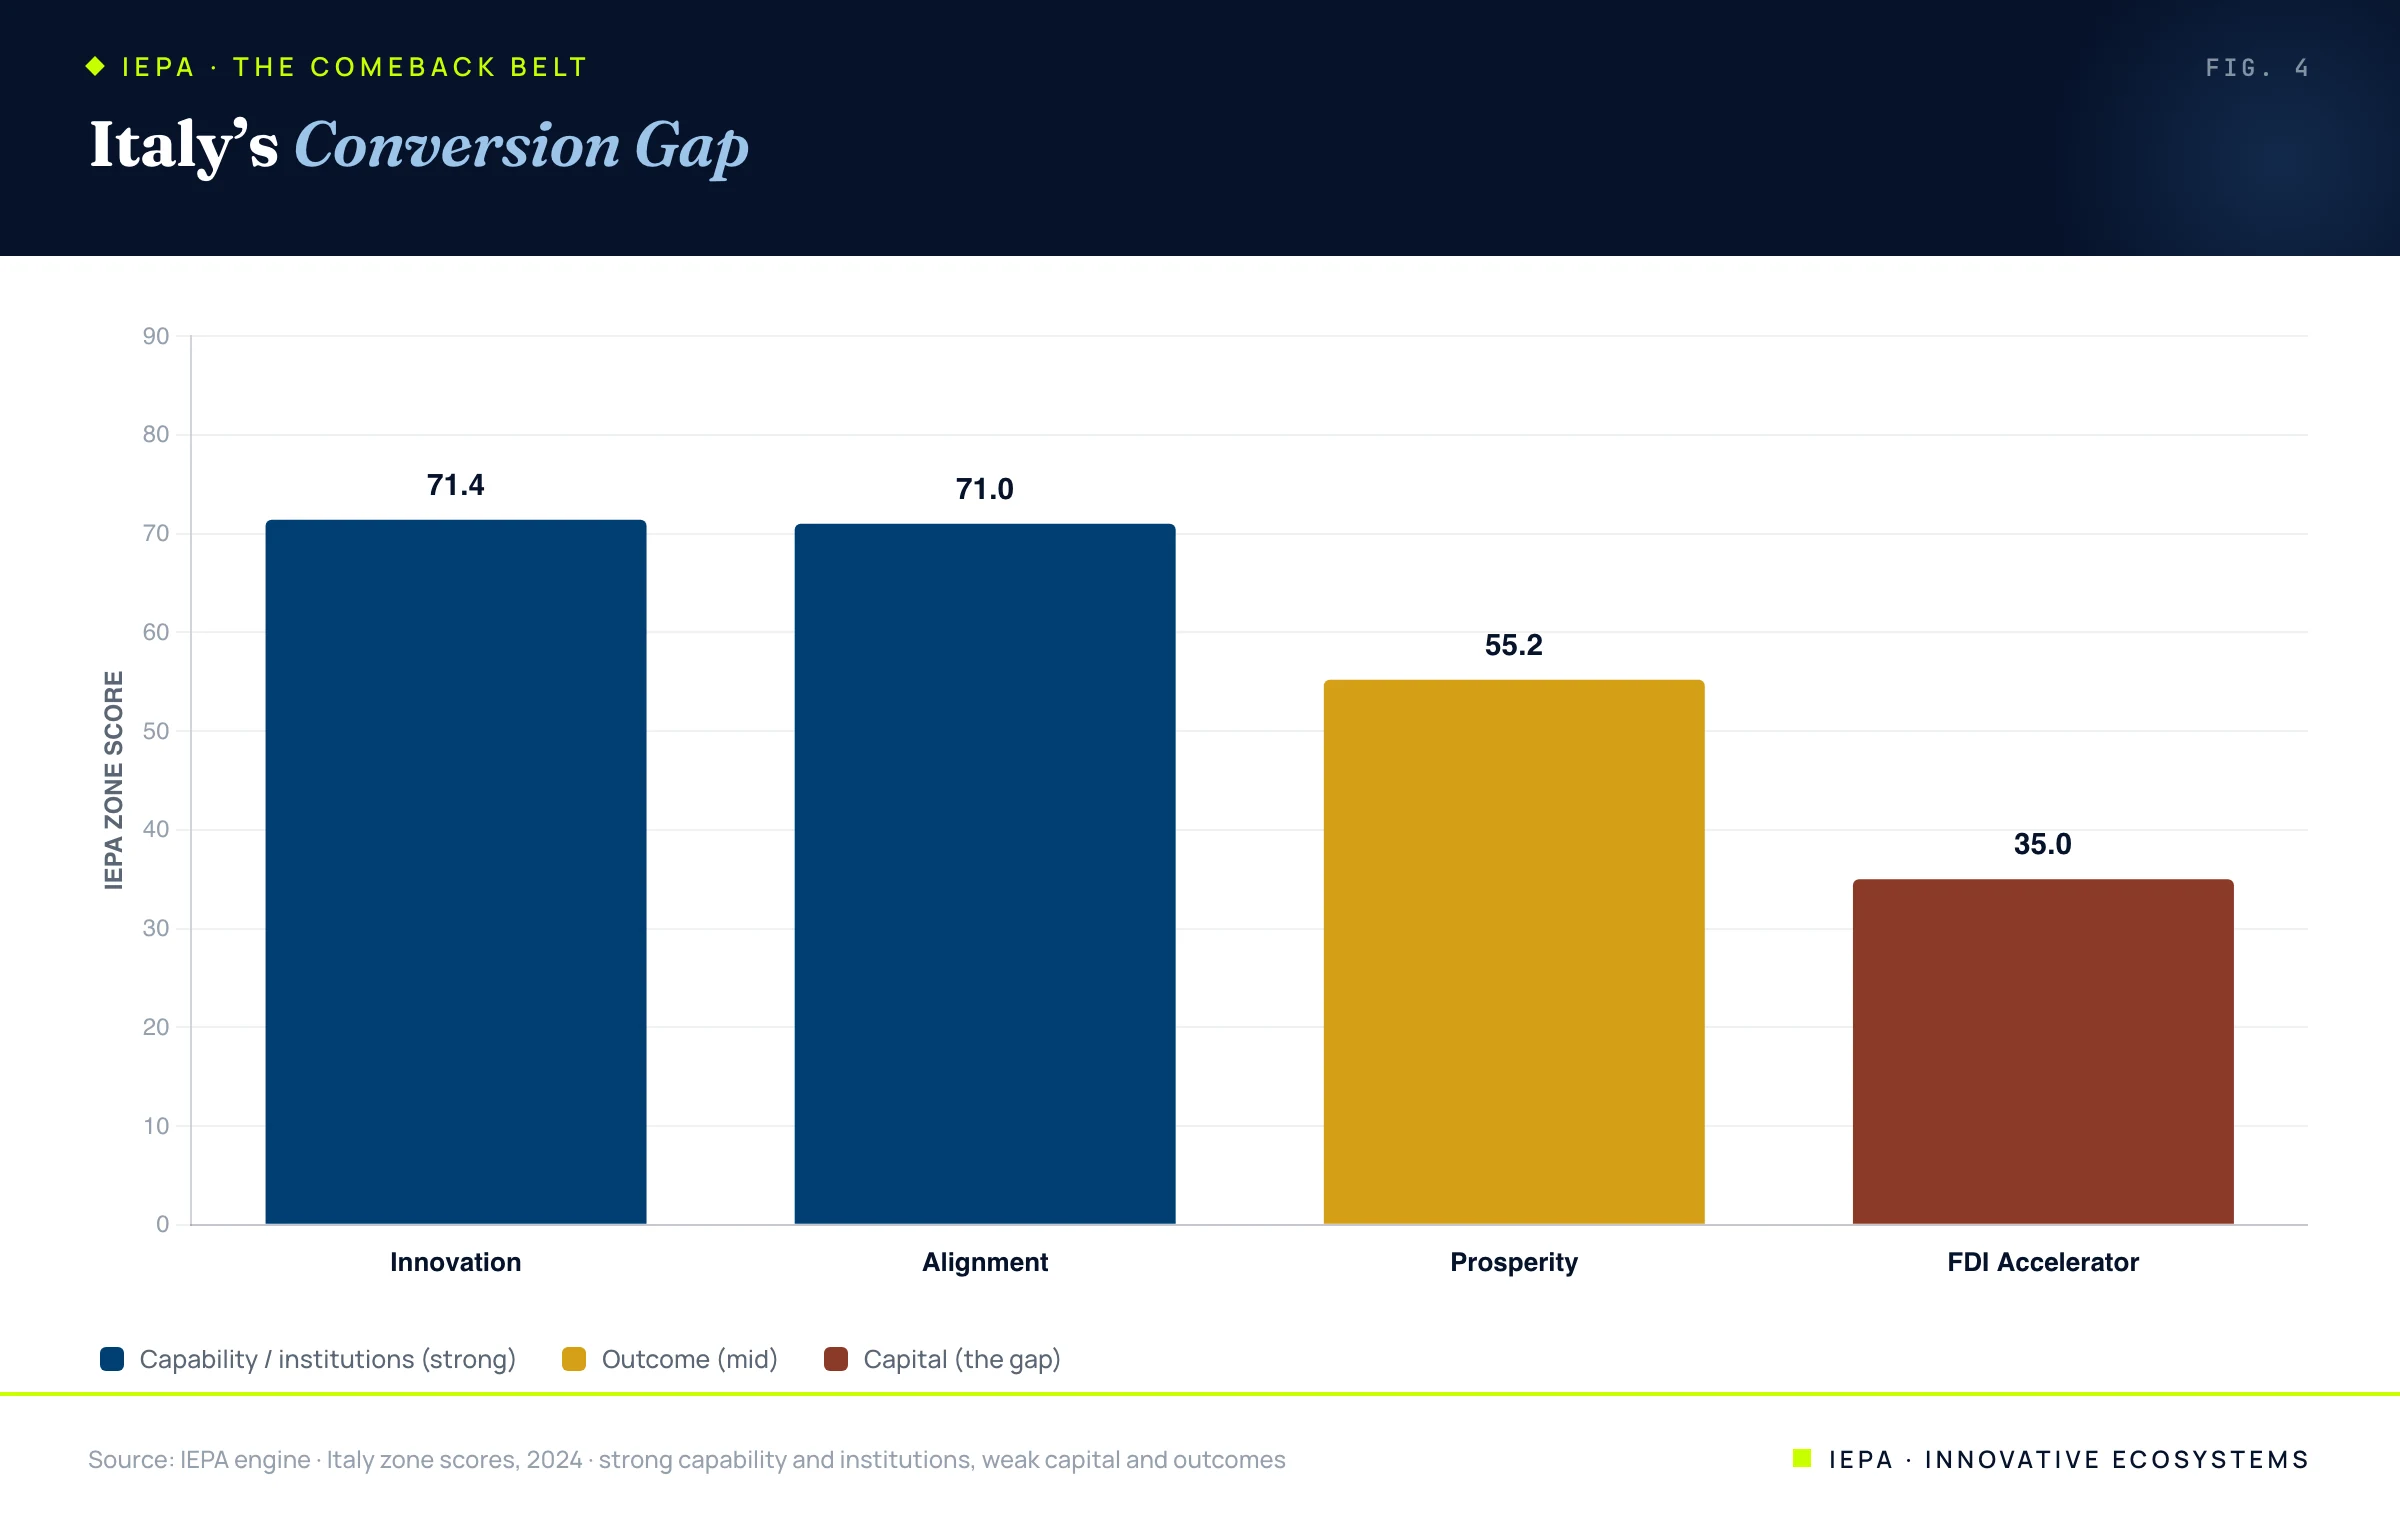
Italy's constraint is therefore not capability and not, unusually for the belt, governance. It is conversion: the missing apparatus that turns a capable, well-governed economy into one that actually attracts and lands productive capital at the regional level. And the belt itself supplies the proof of concept, because the comebacks that worked, Croatia, Portugal, Greece, were all FDI-led. The lever that drove the periphery's recovery is precisely the lever Italy has not pulled.
This is the Innovative EcoSystems thesis, and it is Gerschenkron's prescription operationalized. Where market depth is missing, you substitute an institutional arrangement to supply it. Our HoldCo-to-SPV architecture is that substitution: it packages a region's latent capacity, its anchors, its public commitments, its underwritten pipelines, into vehicles that foreign capital can actually enter. A high-capability, well-governed economy whose binding constraint is conversion is exactly where that substitution pays, and Italy is that economy in the data: the production frontier of a leader, the institutions of a leader, and the capital intensity of a laggard. Conversion is the one thing the belt proves can be engineered rather than waited for.
06What the Belt Says
The Comeback Belt is the IE thesis written in fifteen years of data. Catch-up is real and measurable; it is overwhelmingly capital-led; and its durability is gated not by capability but by the institutional conversion machinery that the fastest risers have conspicuously failed to build. That gap is a risk for them and an opportunity for any operator who can supply what they are missing. The economies that will convert their comeback into a permanent place at the frontier are the ones that build, or are given, the conversion apparatus. Backwardness, as Gerschenkron taught, is an advantage only for those equipped to seize it, and equipping a region to seize it is the entire business of Innovative EcoSystems.
All economy and zone-level scores, the convergence regression, and the comeback decomposition are computed from the proprietary IEPA engine maintained by Innovative EcoSystems. Academic and external sources are listed below.
- Gerschenkron, A. (1962). Economic Backwardness in Historical Perspective. Harvard University Press.
- Abramovitz, M. (1986). Catching Up, Forging Ahead, and Falling Behind. Journal of Economic History, 46(2), 385–406.
- Barro, R. J., & Sala-i-Martin, X. (1992). Convergence. Journal of Political Economy, 100(2), 223–251.
- Eichengreen, B., Park, D., & Shin, K. (2012). When Fast-Growing Economies Slow Down (Middle-Income Trap). NBER Working Paper 18673.
- Innovative EcoSystems. The IEPA Index, The FDI Paradox, and State of the Index 2026 (companion papers).
- WIPO (2024). Global Innovation Index 2024.
- UNCTAD (2024). World Investment Report 2024.
- Kazakhstan secures $10bn AI infrastructure deals with Firebird and Nvidia. Investment Monitor, June 2026.