Singapore vs the United States
Two models of a high-performance economy, and what happens when the highest peak meets the highest floor
The United States and Singapore are both elite economies, but they are elite in fundamentally different shapes. The American profile is spiked: a world-beating peak on entrepreneurship, world-class innovation, and conspicuous troughs on the institutional and capital-attraction zones beneath. The Singaporean profile is balanced: no single zone leads the world, but none falls far, and the whole structure sits high. On the overall index, Singapore ranks 3rd of 117 and the United States 10th. The reason is not that Singapore is better at anything in particular. It is that Singapore is bad at nothing, and the United States is. This is the Balance Premium in its starkest single comparison: the economy with the higher floor beats the economy with the higher peak.
- The US has the higher peak. Its entrepreneurship score of 92 ranks 2nd in the world; no Singaporean zone scores above 87.
- Singapore has the higher floor. Its weakest zone, at 63, sits nine points above the American floor of 55.
- Singapore is far more even. Its six zones have roughly half the dispersion of the American profile (a spread of 23 points against 37).
- Balance wins the outcome. Singapore ranks 1st in the world on realized Prosperity Outcomes; the United States ranks 17th. The composite follows: 76.7 to 71.0.
The United States builds the most spectacular single capability on earth. Singapore builds the most even economy among the world's leaders. When the IEPA scores them across six zones of competitiveness, the contest between brilliance and balance produces a clean and slightly uncomfortable verdict: the balanced economy wins, and it is not particularly close.
01Two Shapes
The fastest way to understand the difference is to look at the two profiles drawn over each other. Plotted across the six IEPA zones, the United States and Singapore trace fundamentally different shapes, and the shapes are the whole argument.
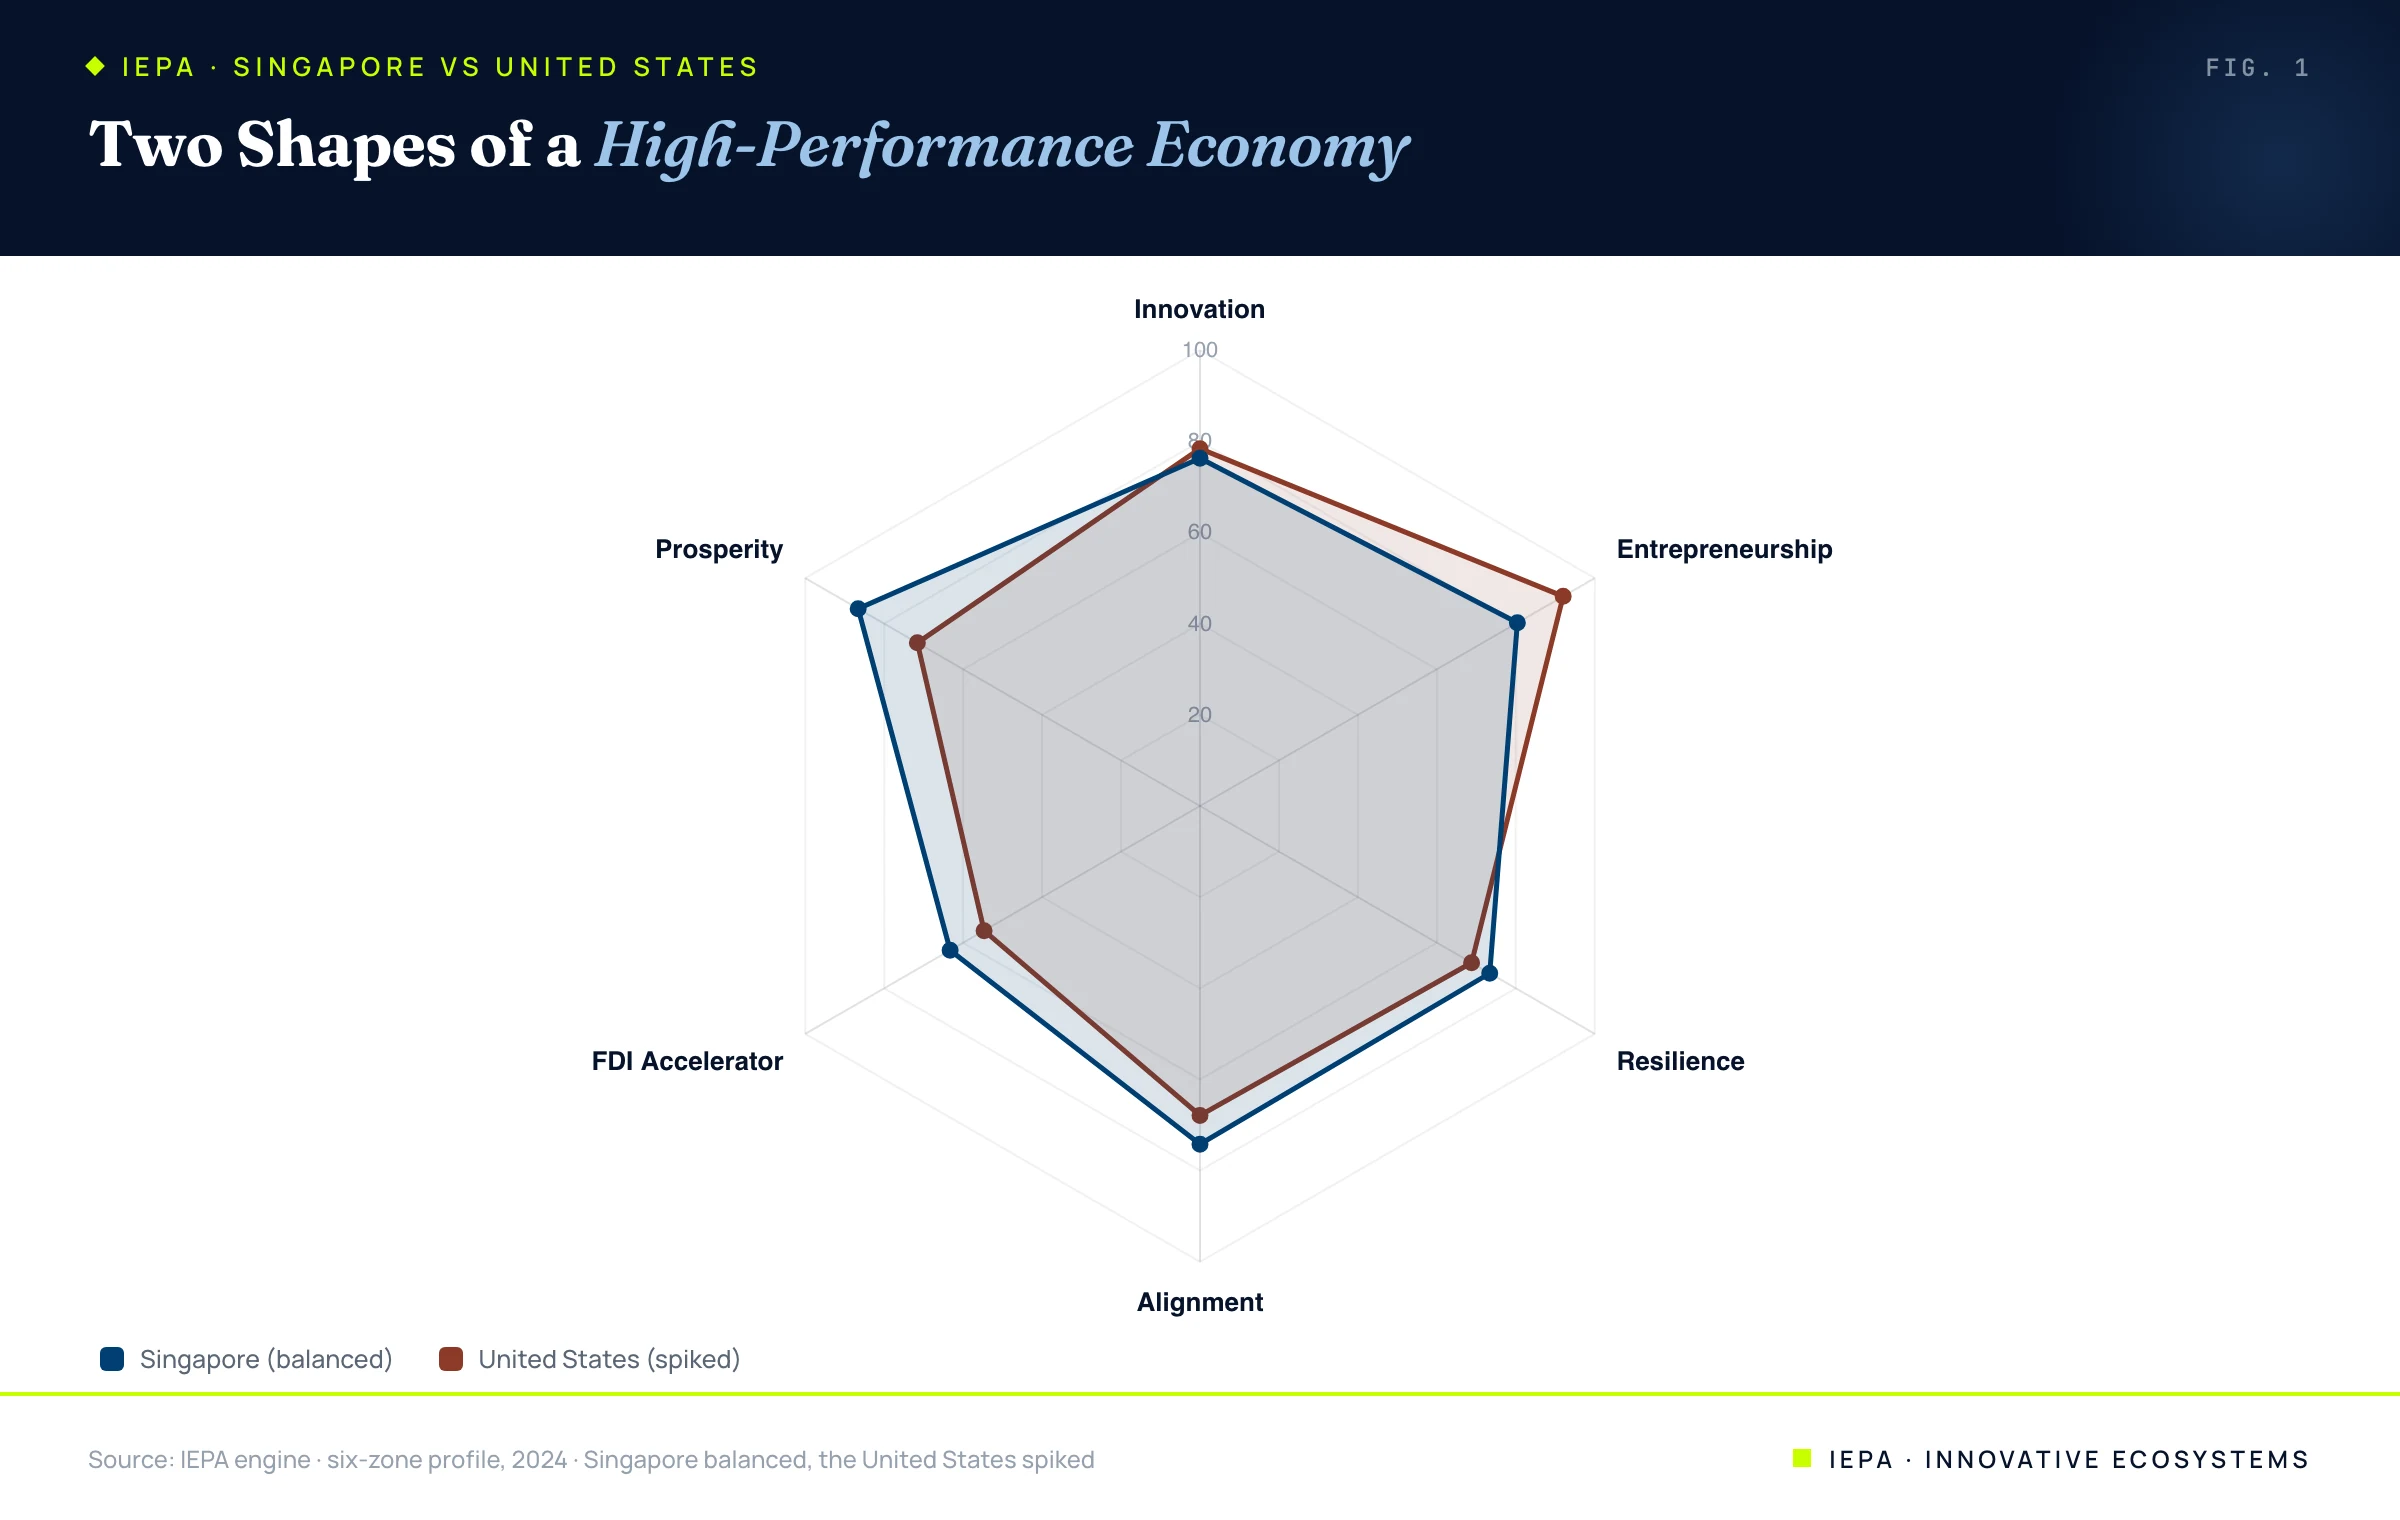
The American shape is a star with one very long point. It surges outward at entrepreneurship and innovation, the zones where the United States is genuinely among the best on earth, and then collapses inward at alignment and foreign-investment attraction. The Singaporean shape is closer to a regular hexagon, slightly smaller at its single tallest point but far fuller everywhere else, and pushed furthest out precisely at prosperity, the realized outcome the whole structure exists to produce. One economy is brilliant in a direction. The other is strong in the round.
02The Higher Peak
Begin with what the United States does better, because it is formidable. On entrepreneurship, the American economy scores 92 and ranks 2nd in the world, an extraordinary concentration of firm formation, risk capital, and scaling capacity that no other large economy approaches. On innovation it scores 78 and ranks 11th. These are not marginal advantages; they are the engines of a genuinely world-leading capability, and Singapore does not match them. Singapore's strongest input zone, entrepreneurship at 80, would be a very good American zone, not a great one.
If an economy were scored only on its best two zones, the United States would win this comparison comfortably. The American model, the decentralized, market-coordinated economy that specializes in radical, disruptive innovation, is built to produce exactly these towering peaks, and it does. The question the index forces is whether the peaks are enough.
03The Higher Floor
They are not, because an economy is not scored only on its best zones, and neither is it experienced that way. Where the United States surges on its strengths, it sags on its weaknesses, and the sag is the story. American alignment, the coherence of its institutions, ranks 32nd in the world. American FDI intensity ranks 39th. Its weakest zone bottoms out at 55.
Singapore has no such trough. Its lowest zone, foreign-investment attraction, scores 63, which would rank as a respectable middle zone for most economies and sits nine full points above the American floor. Singapore never reaches the American heights, but it never falls to the American depths either, and the two facts do not cancel. They compound in Singapore's favor.
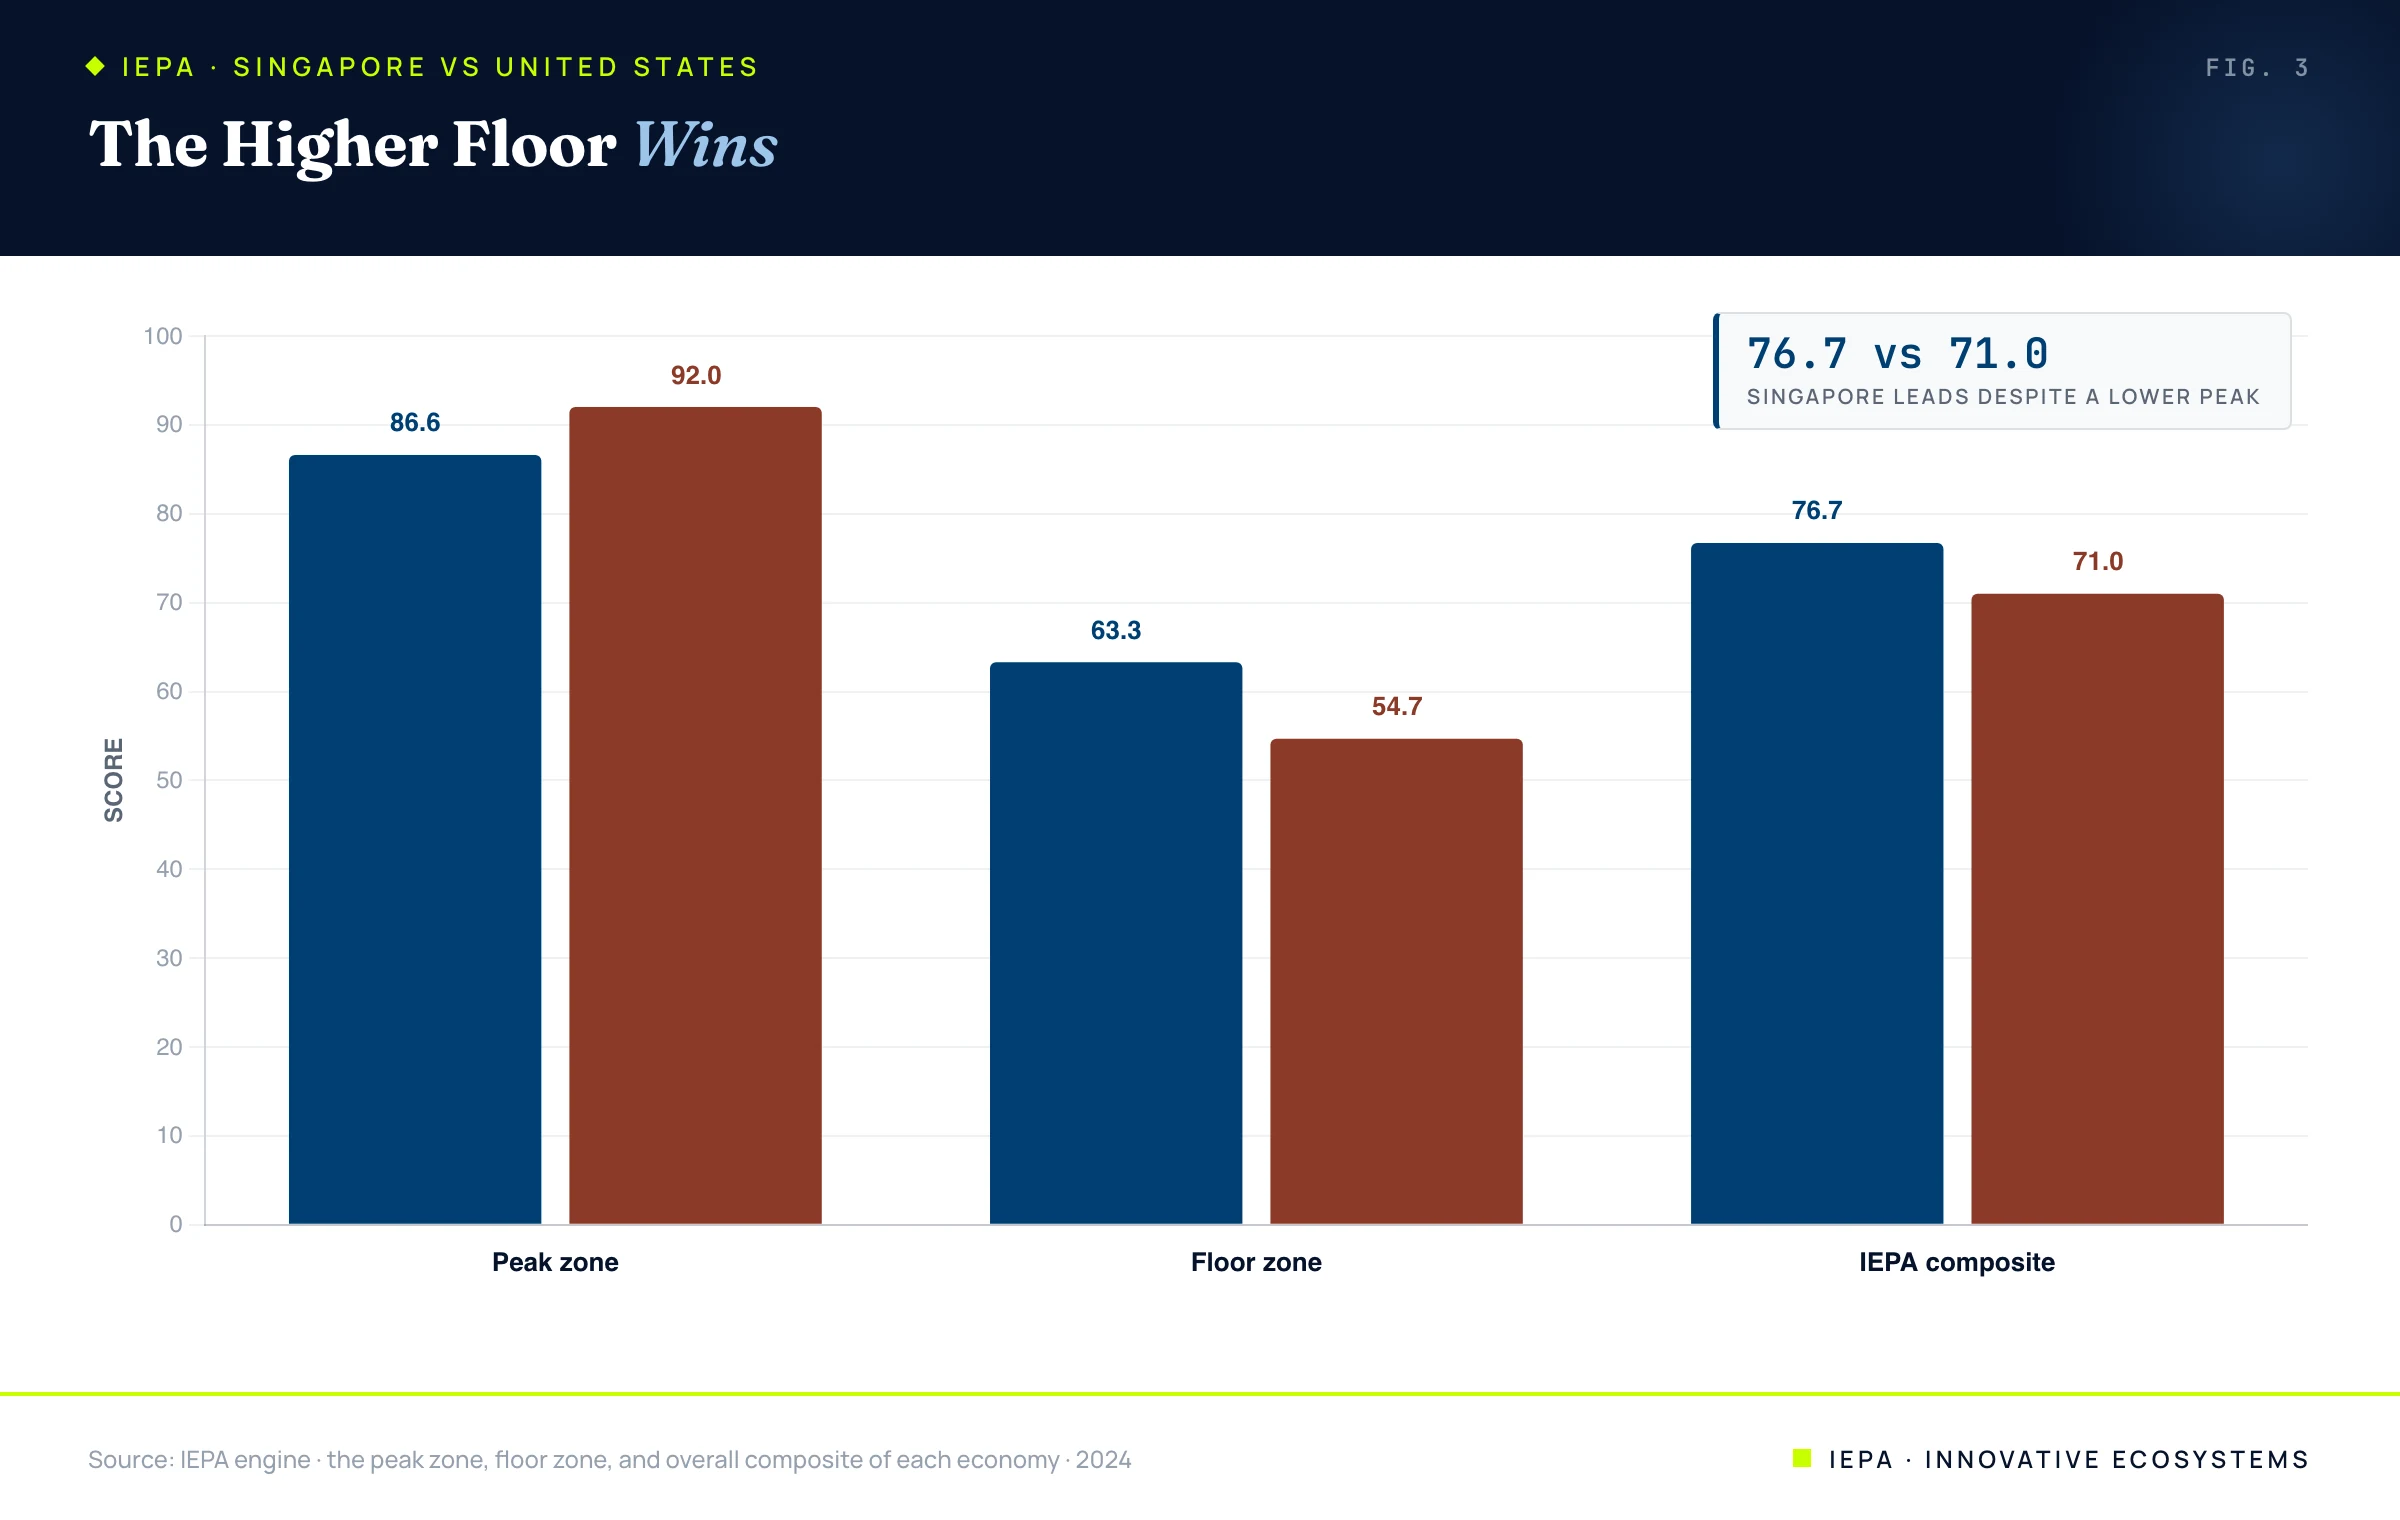
The United States has the higher ceiling. Singapore has the higher floor. The floor wins, because prosperity is built at the bottom of the profile, not the top.
This is the Balance Premium stated as a single duel. We have shown across all 117 economies that realized prosperity correlates more tightly with an economy's weakest zone than with its strongest. Singapore and the United States are that finding made flesh. The American peak of 92 is magnificent and largely beside the point; the American floor of 55 is what binds the system. Singapore wins not by building anything as tall as the American peak, but by refusing to let any zone fall as far as the American floor.
04Where Each Wins, and Who Wins Overall
Laid out zone by zone, the scorecard looks, at first, like it should favor the United States.
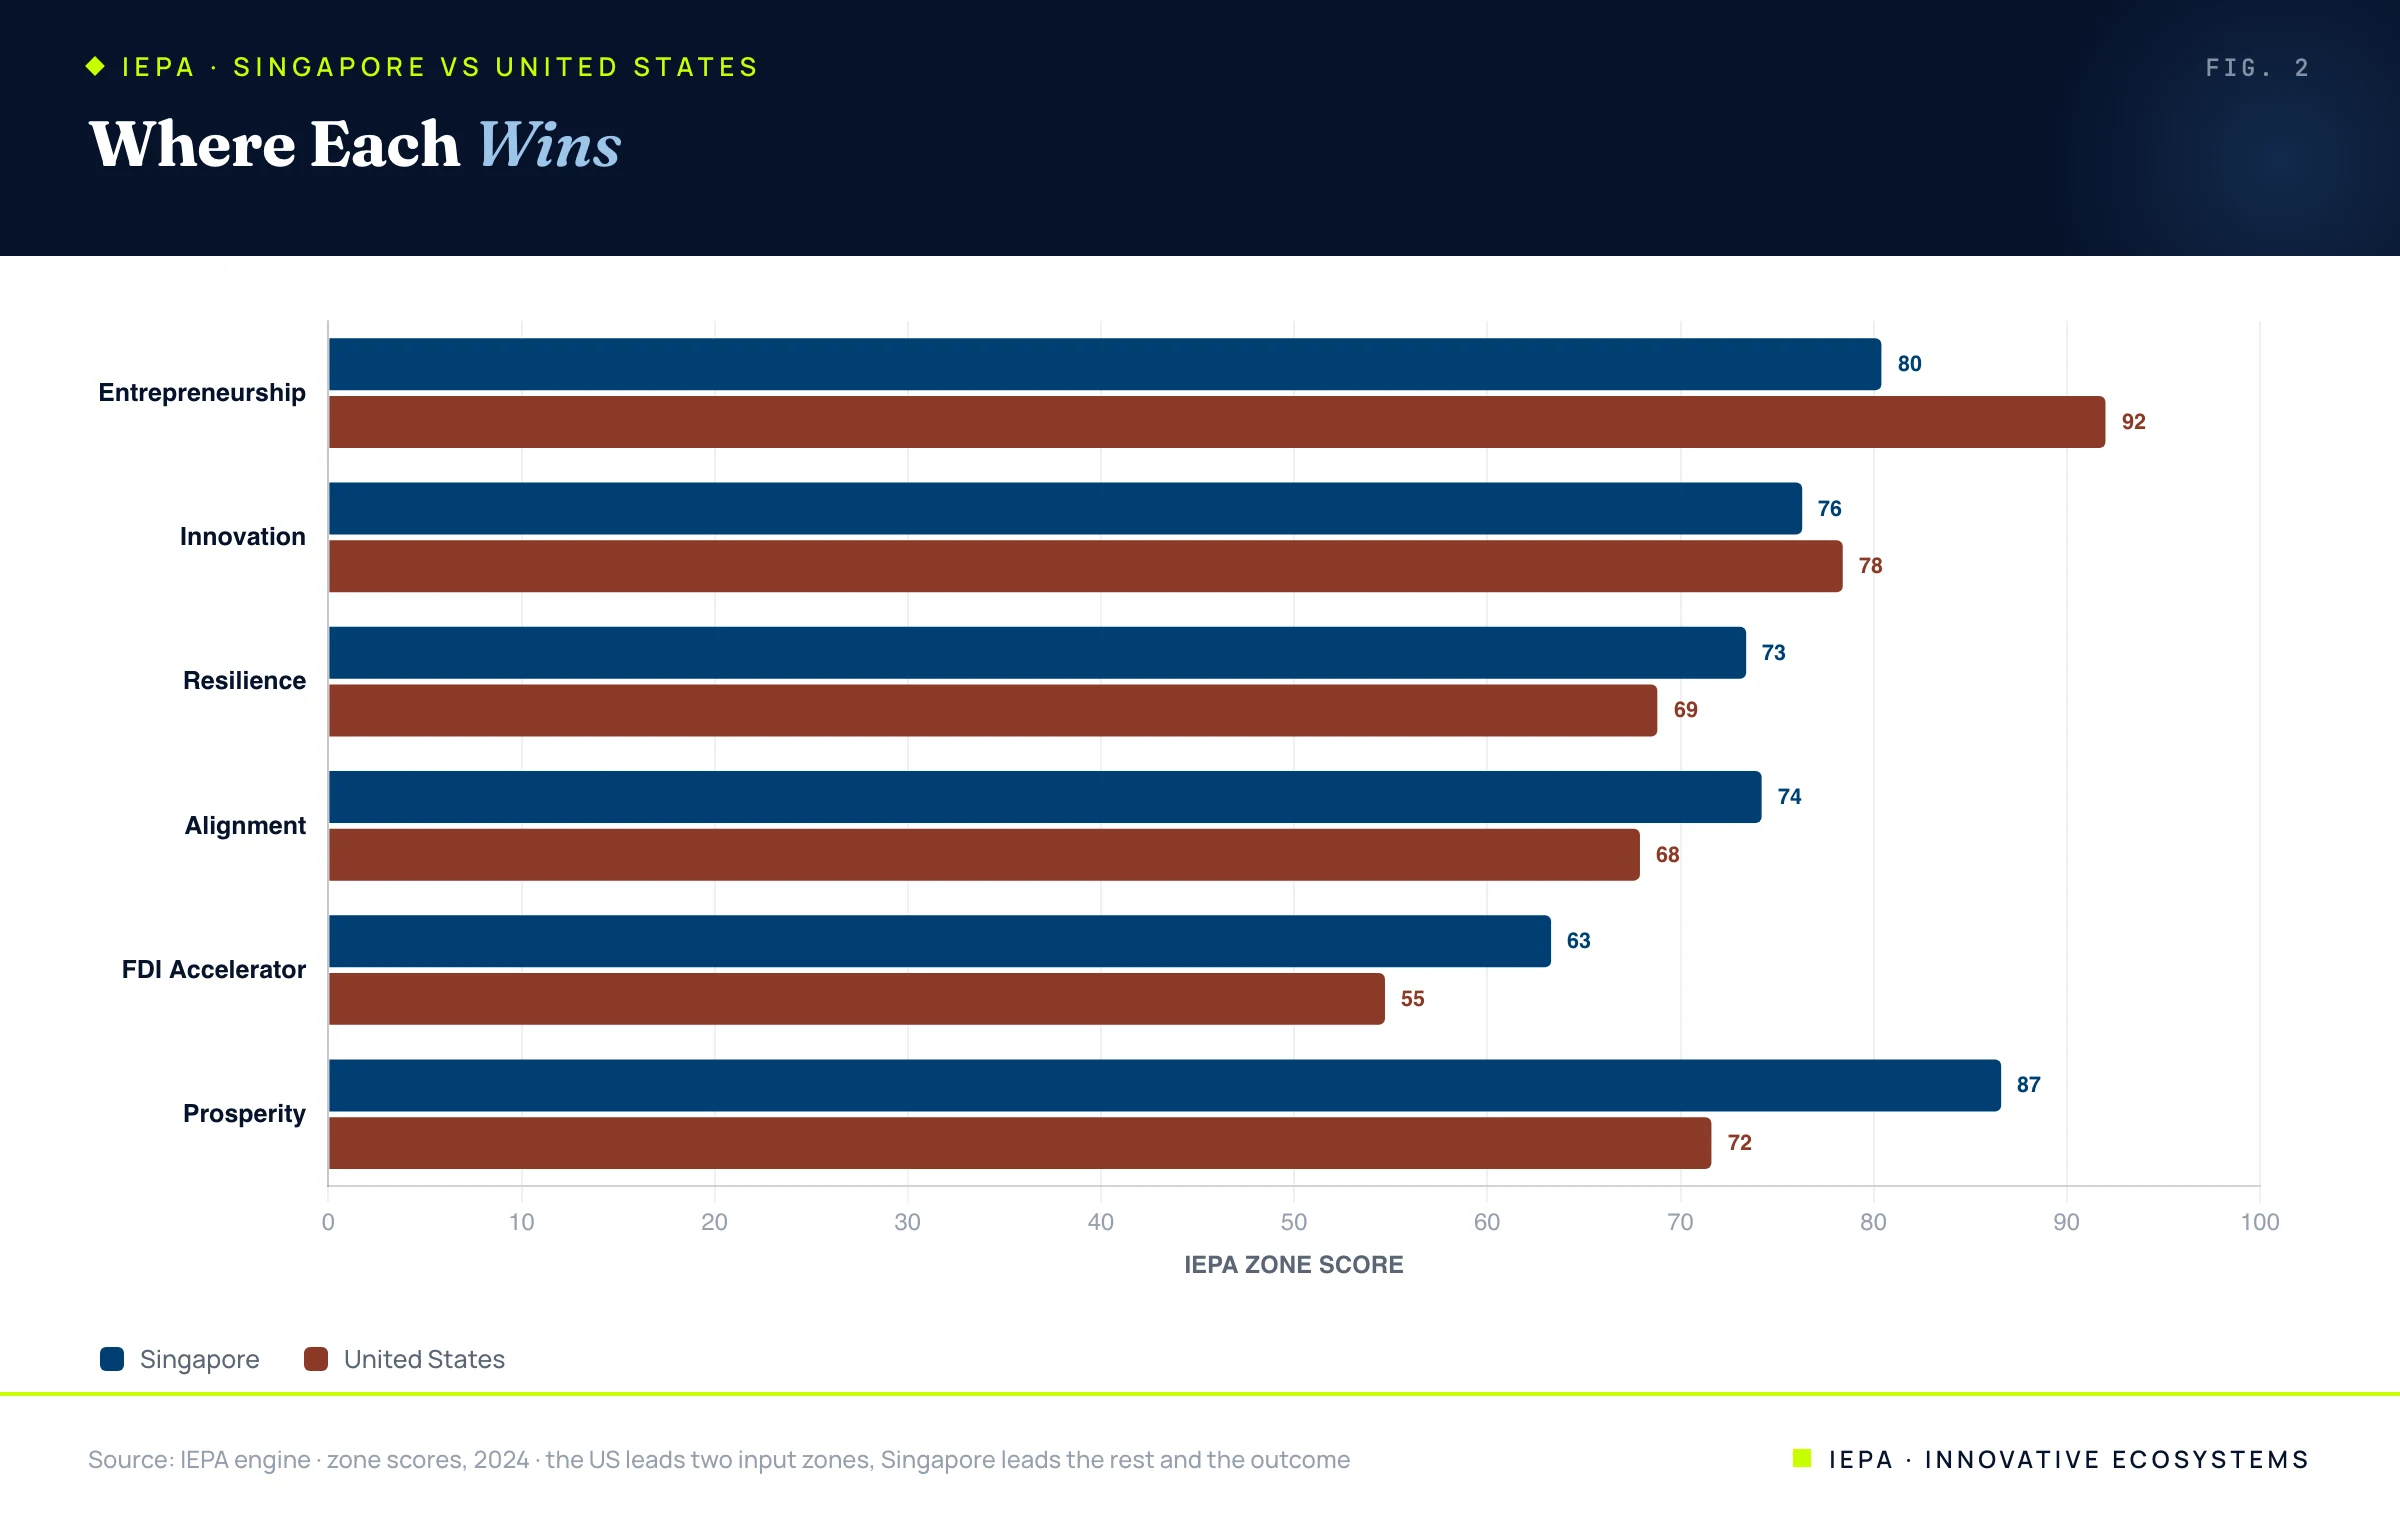
The United States wins two of the six zones, and wins them emphatically. Singapore wins the other four, and wins the most important one, prosperity, by fifteen points. Here is the uncomfortable arithmetic at the center of this comparison: the United States is the better economy on its two best dimensions and the worse economy overall. Brilliance in two zones is outscored by competence in six. The composite, 76.7 for Singapore against 71.0 for the United States, is not a coin-flip; it is a structural verdict, and it points at the floor every time.
| Measure | Singapore | United States |
|---|---|---|
| Overall IEPA | 76.7 (3rd) | 71.0 (10th) |
| Highest zone | 86.6 | 92.0 |
| Lowest zone | 63.3 | 54.7 |
| Spread (peak minus floor) | 23.3 | 37.3 |
| Prosperity Outcomes rank | 1st | 17th |
05Two Models, Not One Winner
It would be a misreading to take this as a claim that the American model is broken. It is not; it is a different model, and a coherent one. The comparative-capitalism tradition has long distinguished the liberal, market-coordinated economy, of which the United States is the archetype, from the more coordinated and state-guided economies that organize themselves differently. The varieties-of-capitalism framework even predicts the American shape directly: liberal market economies are built to specialize in radical, disruptive innovation, and they pay for that specialization with less institutional coordination elsewhere. The towering American entrepreneurship peak and the sagging American alignment trough are not an accident. They are two sides of the same model.
Singapore is the other model run with unusual discipline: a coordinated, state-guided economy that deliberately refuses to let any pillar fall behind, and converts that evenness into the highest realized prosperity in the index. Both are high-performance economies. They simply optimize for different things, one for the height of the peak, the other for the height of the floor.
06What the Comparison Teaches
For a region deciding how to build, the lesson is not to imitate Singapore's politics or America's culture. It is to understand which variable the index rewards. The American model proves that a spectacular peak is achievable and genuinely valuable; the Singaporean model proves that, when the goal is realized prosperity, a high floor beats a high ceiling. Most regions are not choosing between being the United States and being Singapore. They are choosing whether to pour their resources into one spectacular strength or into lifting their weakest zone, and the data is unambiguous about which choice converts into prosperity.
For Innovative EcoSystems, this is the empirical core of how we advise a region. We do not chase a single headline peak. We find the floor, the zone that is quietly capping the whole structure, and we raise it, because the lesson of Singapore against the United States is that the economy which wins is the one with no weak link, not the one with the tallest strength.
All zone scores, ranks, and dispersion statistics are computed from the proprietary IEPA engine maintained by Innovative EcoSystems. Related sources below.
- Hall, P. A., & Soskice, D. (2001). Varieties of Capitalism: The Institutional Foundations of Comparative Advantage. Oxford University Press.
- Innovative EcoSystems. The IEPA Index, State of the Index 2026, and Lopsided (companion papers).
- WIPO (2024). Global Innovation Index 2024.
- UNCTAD (2024). World Investment Report 2024.
- UNDP. Human Development Index data.
Innovation Capacity Is Not Innovation Output
The conversion gap: economies with world-class inputs and missing results, quantified.
→Explore the IEPA
Six zones, every market this research is scored from.
→Open the Atlas
The live global registry this research is drawn from.
→