Innovation Capacity Is Not Innovation Output
Sweden leads the world on the inputs to innovation. It ranks middling on the payoff. That gap is one of the most important numbers we measure.
The first of the six IEPA zones is Innovation Capacity: an economy's stock of the things innovation requires, talent, research, institutions, and a knowledge base. It is the zone most often mistaken for the prize itself. This is what it measures, what it does not, and why a country can lead the world on it and still leave the payoff on the table.
- Capacity is a potential, not a product. It scores the inputs a country has assembled, not the firms, exports, or prosperity it converts them into. The academic concept it draws from, national innovative capacity, was built precisely to separate the two.
- The leaders prove the point. Sweden tops the zone at 89 and posts Prosperity Outcomes of 62, a 27-point conversion gap. South Africa, Brazil, France, and the United Kingdom carry the same pattern: strong capacity, thinner payoff.
- Capacity does not buy openness. Innovation Capacity correlates with the FDI Accelerator at just 0.23. China scores 80 on capacity and 9 on openness. The lab and the capital are nearly unrelated lists.
- This is why a single innovation rank misleads. It sells the input as the achievement. The IEPA index keeps capacity separate from what converts it, because the gap between them is the actual work.
On the 23rd of June 2026, the United Kingdom announced sixty million pounds for university AI labs. It is good policy, and it is also a familiar instinct: when a country wants to be more innovative, it buys more innovation capacity. More labs, more researchers, more grants. The instinct is not wrong, but it answers a question the United Kingdom has largely already answered. Its Innovation Capacity sits at 85, fifth in the world. What it has not solved is conversion. More inputs into a system that already leads on inputs is not the same as more output, and the difference between those two things is the entire subject of this zone.
01What the Zone Measures
Innovation Capacity scores the upstream stock: the supply of researchers and skilled talent, the depth of research and development, the strength of universities and the institutions that protect and diffuse knowledge, and the accumulated base a country can draw on. The academic lineage is explicit. The concept of national innovative capacity, formalized by Furman, Porter, and Stern, was designed to measure a country's underlying ability to produce innovation, deliberately held apart from the innovations actually produced in any given year.
That separation is the whole point. A country can stock the inputs and fail to convert them, or convert thinly, or watch the output flow to other economies that were better at commercializing it. Capacity is the engine block. Whether the car moves is a different measurement, and in the IEPA framework it is a different zone.
02The Leaders, and What Sits Beside Them
Rank the field on Innovation Capacity alone and you get a roll call of advanced economies. The instructive move is to read the next columns across, where the same countries report what their capacity converts into.
| Economy (2024) | Innovation | Entrepreneurship | FDI Accel. | Prosperity |
|---|---|---|---|---|
| Sweden | 89 | 82 | 75 | 62 |
| United Kingdom | 85 | 90 | 29 | 67 |
| Switzerland | 83 | 91 | 51 | 74 |
| Netherlands | 83 | 64 | 56 | 76 |
| Denmark | 82 | 84 | 77 | 75 |
| China | 80 | 77 | 9 | 70 |
| United States | 78 | 92 | 55 | 72 |
Sweden has assembled the most innovation capacity of any economy in the index and turns it into Prosperity Outcomes of 62, below several economies with far weaker labs. China pairs the third-highest capacity on earth with an FDI Accelerator of 9, a near-total disconnection between what it can invent and the capital it lets in. Only Denmark, which we have written about as the balanced reference design, carries its capacity cleanly through to a 75 on prosperity. Capacity is necessary. It is nowhere near sufficient.
03The Conversion Gap
Subtract an economy's realized Prosperity Outcomes from its Innovation Capacity and you get a single, blunt diagnostic: is this a country whose payoff outruns its inputs, or one whose inputs outrun its payoff? Both failure modes exist, and they call for opposite interventions.
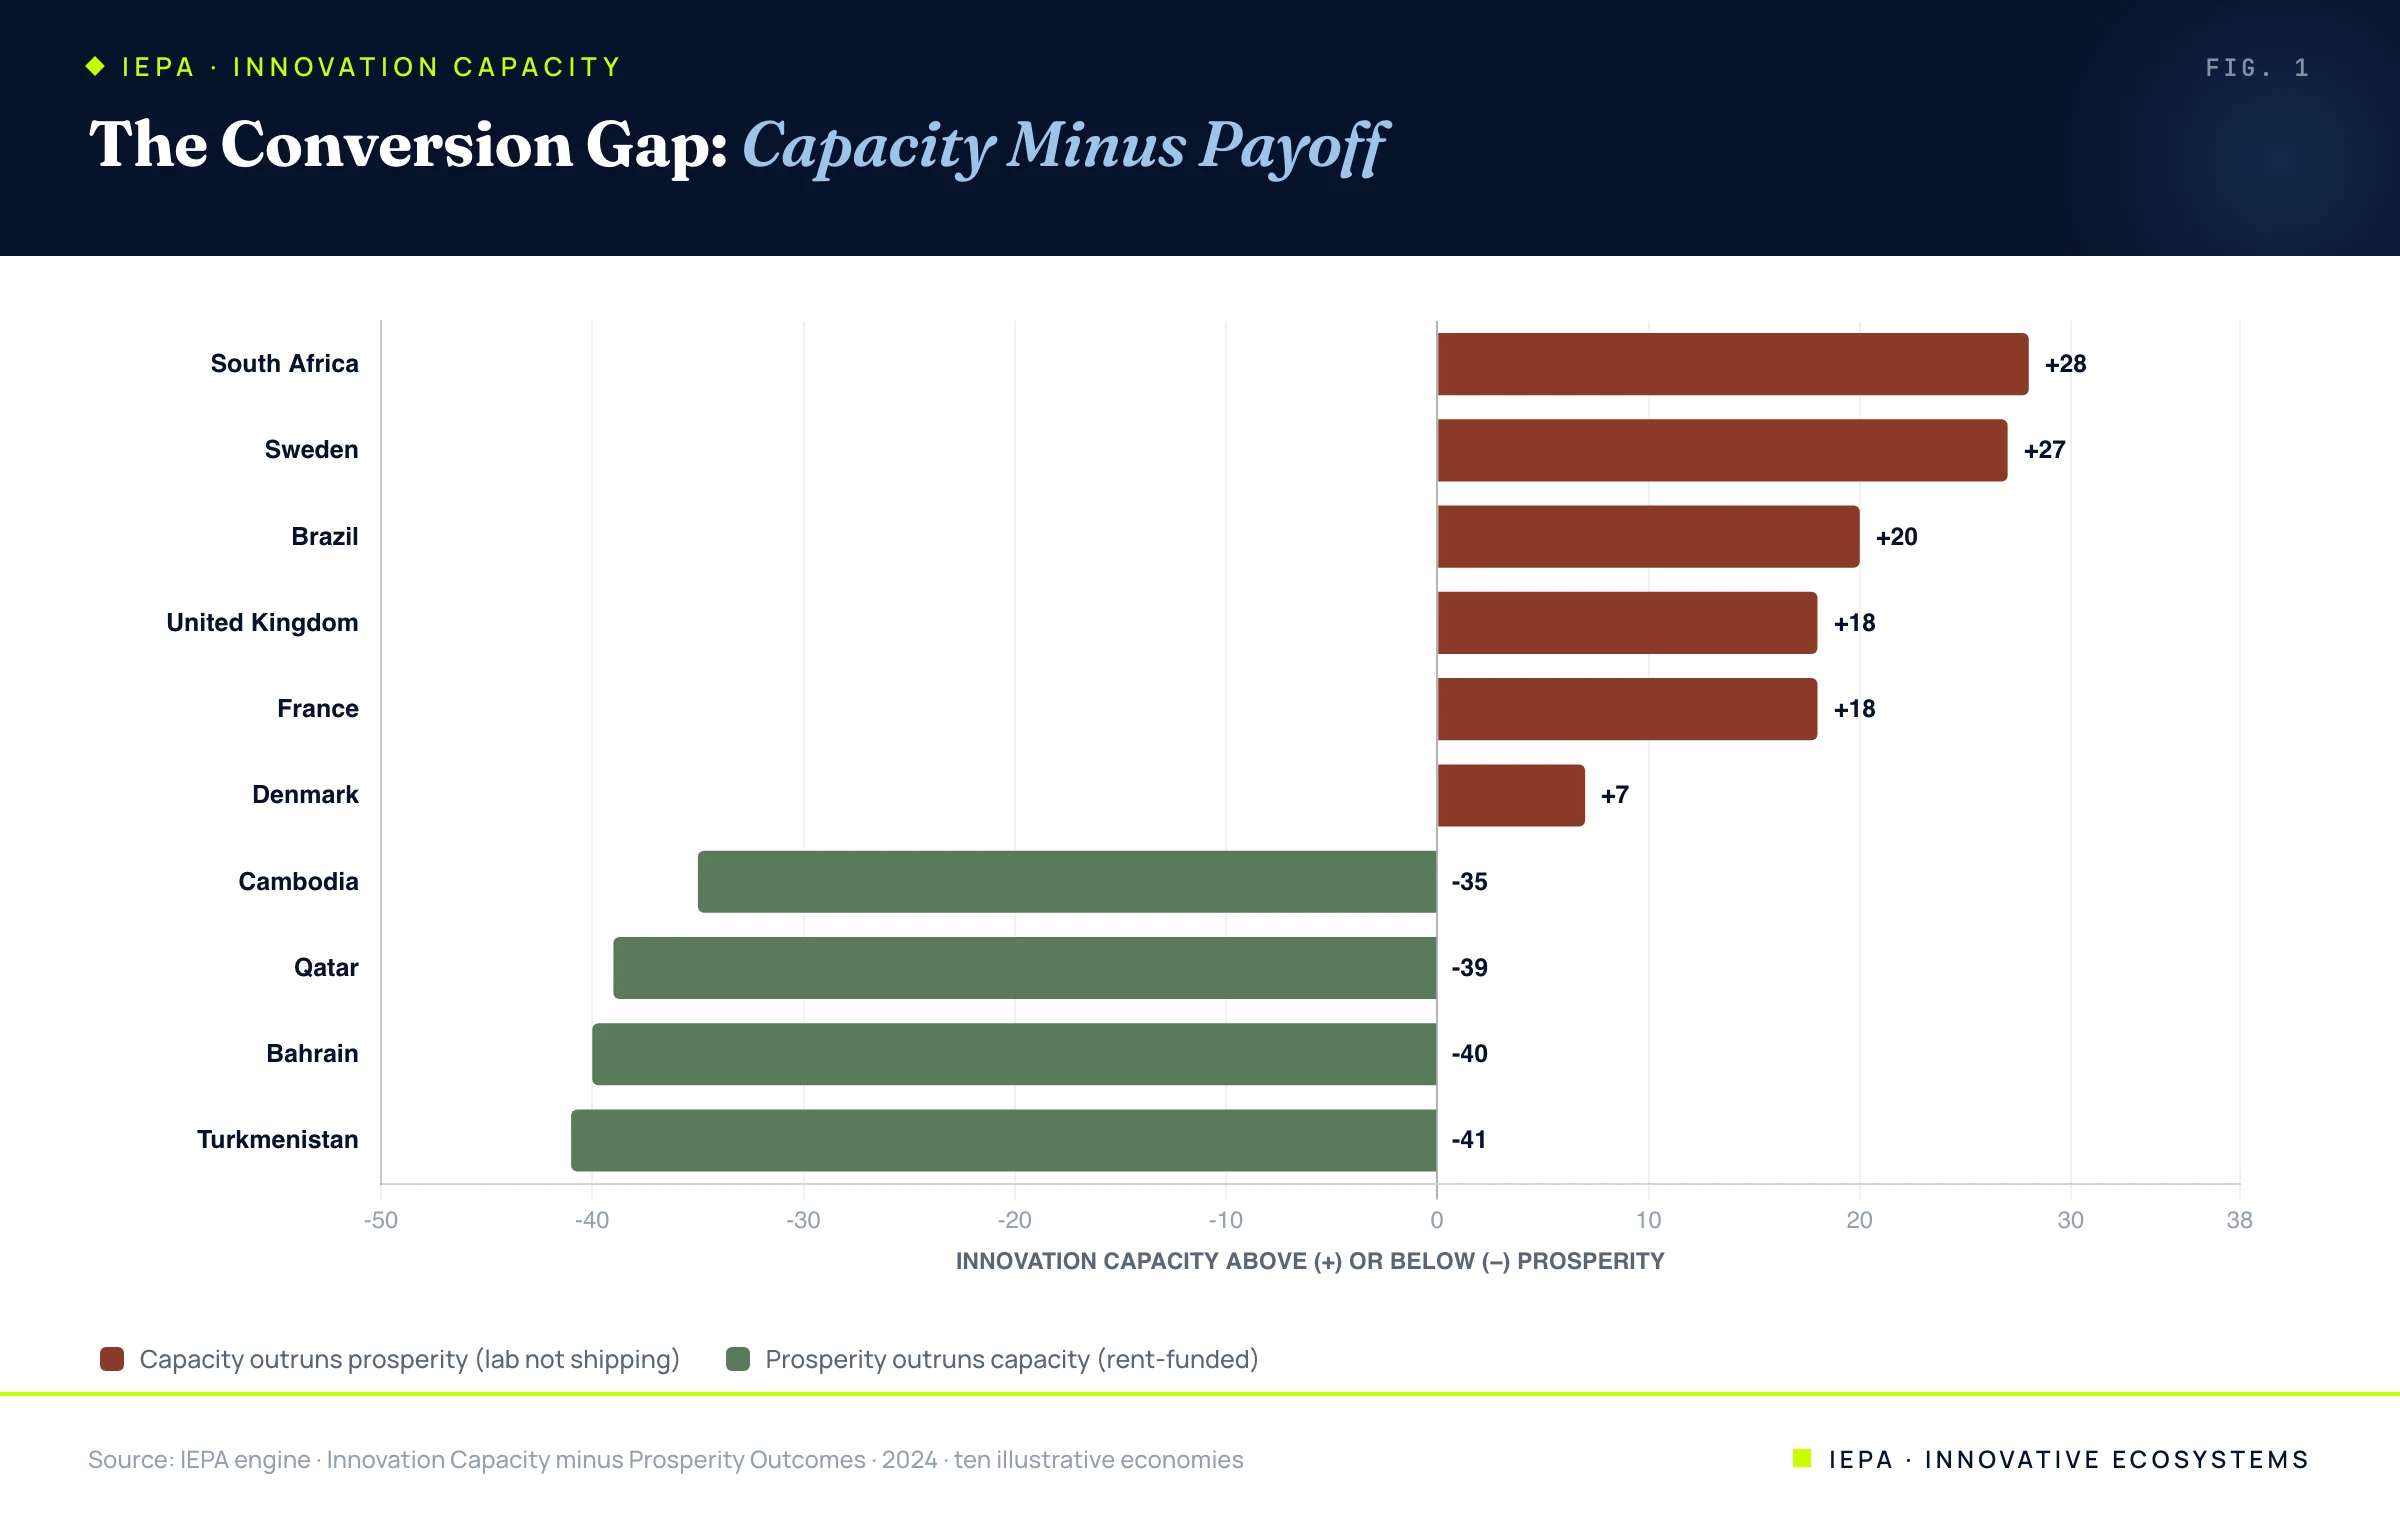
The two tails are different diseases. The sage economies, Turkmenistan, Bahrain, Qatar, are prosperous on hydrocarbons and rents, with almost no innovation base underneath, exactly the bought-not-earned prosperity our portfolio analysis isolated. The rust economies have the opposite problem and it is the more fixable one: South Africa, Sweden, Brazil, and the United Kingdom hold real capacity that is not fully converting into broad outcomes. For a builder, the rust tail is where the work is, because the inputs are already there.
04Why a Single Innovation Rank Misleads
The dominant way the world reads innovation is as one rank, and that rank quietly fuses two different things: the inputs a country assembles and the outputs it produces. Even the most careful single-index efforts know this, which is why the Global Innovation Index reports an input sub-index and an output sub-index separately and publishes an efficiency ratio between them. The moment those are collapsed into one headline position, the distinction the methodologists built in is lost on the reader, and a country is congratulated for its capacity as though it were its result.
The IEPA correlations show why that matters. Innovation Capacity tracks Entrepreneurship Capacity reasonably well, at 0.74, because commercialization at least lives near invention. But it tracks the FDI Accelerator at only 0.23 and Prosperity Outcomes at 0.60. Capacity travels partway to the outcome and no further on its own.
Capacity is the engine block. A rank that crowns the most innovative economy is admiring the engine and calling it the journey.
05The Builder's Reading
This is why Innovation Capacity is the first lens and never the only one. On its own it tells a region what it has, not what it is getting. The honest next questions live in the other five zones: can the economy commercialize what it invents, is it open enough to attract the capital that scales it, do its institutions point the same way, and does any of it reach the population as prosperity. A high capacity score is permission to ask those questions, not an answer to them.
So when a government, like the United Kingdom this week, reaches for more capacity, the IEPA reading is not that the spending is wrong. It is that capacity-rich economies usually have a conversion gap, not a capacity gap, and the higher-return move is to find where their existing inputs stop turning into outcomes. Building the machine that converts capacity into companies, customers, and prosperity is the harder discipline, and it is the one Innovative EcoSystems exists to install.
Zone scores, correlations, and conversion gaps are computed on the live IEPA engine across 117 economies for the 2024 assessment year, the headline reference vintage, with later years treated as trend extension. Scores are normalized 0 to 100. No estimates.
- UK government backs university AI labs with £60M to make AI cheaper. Tech.eu, June 2026.
- Furman, J. L., Porter, M. E., & Stern, S. (2002). The determinants of national innovative capacity. Research Policy, 31(6), 899–933.
- Cornell University, INSEAD & WIPO. Global Innovation Index: input and output sub-indices and the innovation efficiency ratio.
- Cohen, W. M., & Levinthal, D. A. (1990). Absorptive Capacity: A New Perspective on Learning and Innovation. Administrative Science Quarterly, 35(1), 128–152.
- Innovative EcoSystems. Why We Built Six Zones Instead of One Number, and What 117 Economies Taught Us About Prosperity. 2026.
- Innovative EcoSystems. The IEPA Index and Methodology. 2026.
The Park Is Not the Point
A government built technology zones to put companies next to researchers. A tenant survey years later found four percent had started collaborating with them.
→Explore the IEPA
Six zones, every market this research is scored from.
→Open the Atlas
The live global registry this research is drawn from.
→